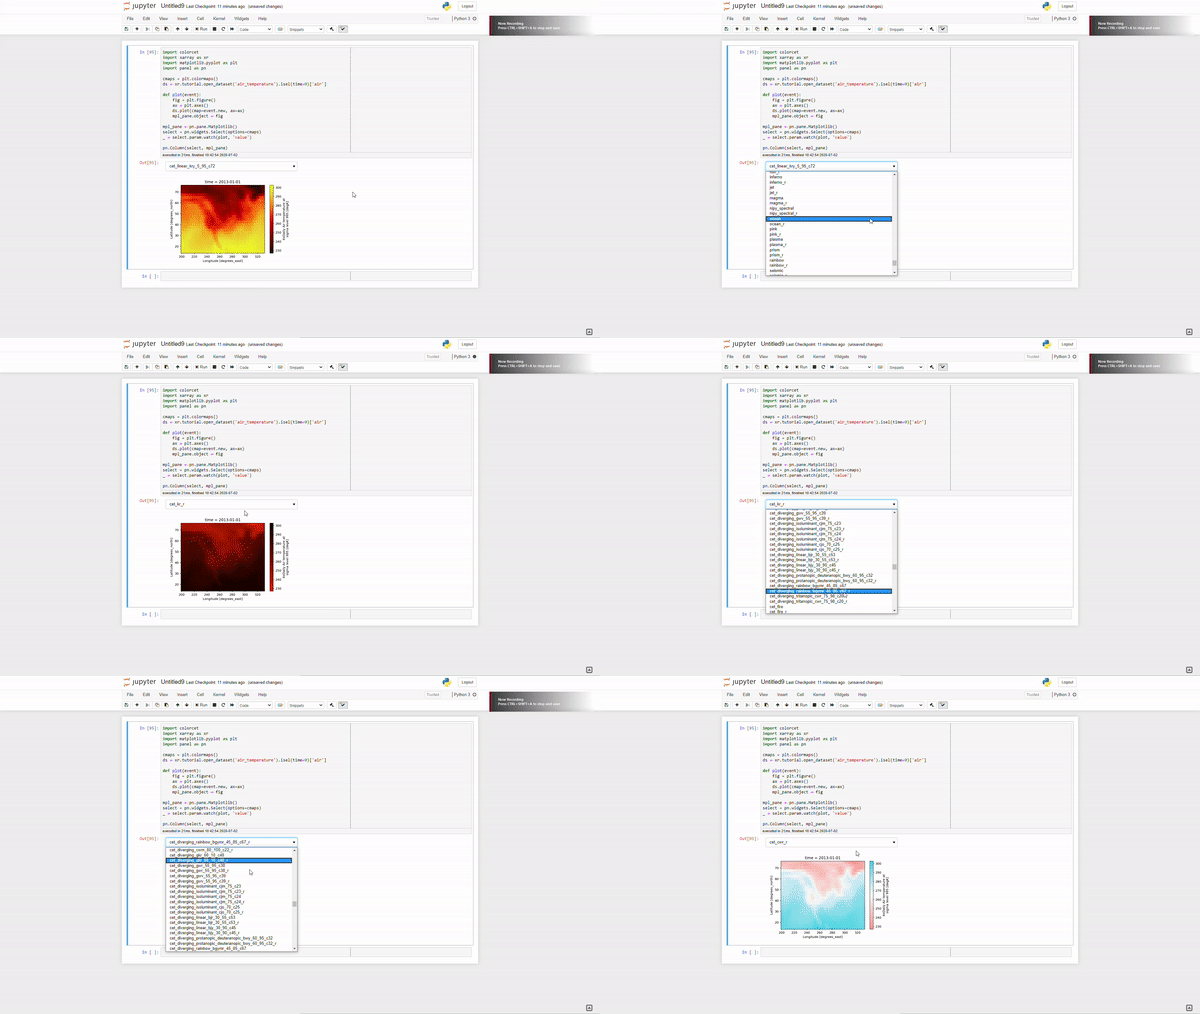
This seems to work for me since it’s already registered in matplotlib’s colormaps, you can just call plt.colormaps to get both matplotlib and colorcet collections
import colorcet
import xarray as xr
import matplotlib.pyplot as plt
import panel as pn
pn.extension()

cmaps = plt.colormaps()
ds = xr.tutorial.open_dataset('air_temperature').isel(time=0)['air']

def plot(event):
    fig = plt.figure()
    ax = plt.axes()
    ds.plot(cmap=event.new, ax=ax)
    mpl_pane.object = fig

mpl_pane = pn.pane.Matplotlib()
select = pn.widgets.Select(options=cmaps)
_ = select.param.watch(plot, 'value')

pn.Column(select, mpl_pane)

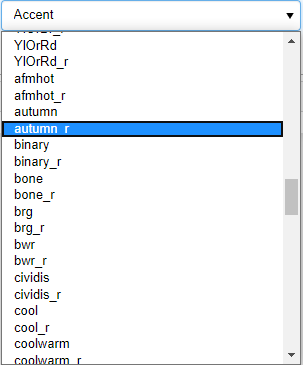
If you comment out import colorcet the colorcet cmaps no longer appear in the dropdown:

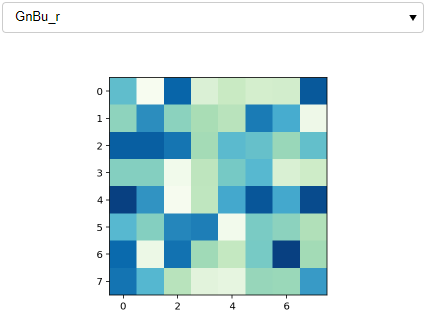
If you don’t have xarray; here’s the numpy version:
import colorcet
import matplotlib.pyplot as plt
import numpy as np
import panel as pn
pn.extension()

cmaps = plt.colormaps()
rndm = np.random.rand(8,8)

def plot(event):
    fig = plt.figure()
    ax = plt.axes()
    plt.imshow(rndm, event.new);
    mpl_pane.object = fig

mpl_pane = pn.pane.Matplotlib()
select = pn.widgets.Select(options=cmaps)
_ = select.param.watch(plot, 'value')

pn.Column(select, mpl_pane)
