Thank you @Marc, let’s see if @philippjfr has something to add.
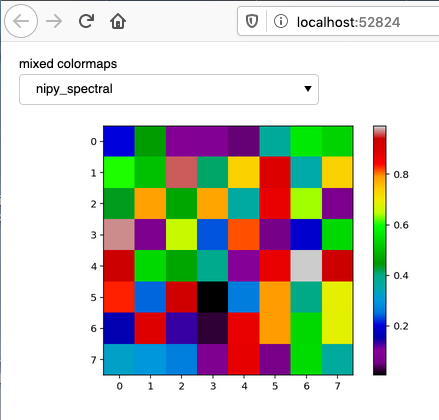
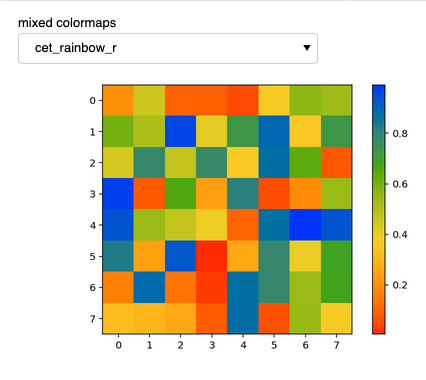
Just to play my own devil’s advocate, this is an example with one colormap from each of Matplotlib and Colorcet, which works.
import numpy as np
import matplotlib.pyplot as plt
import matplotlib.colors as clr
import colorcet as cc

import panel as pn
pn.extension()

colormap = pn.widgets.Select(name='mixed colormaps', options= [
    'nipy_spectral', 'cet_rainbow_r'], value='nipy_spectral')

selection_widget = pn.Row(colormap)

rndm = np.random.rand(8,8)

def plot(data, colormap):
    fig = plt.figure()
    plt.imshow(data, colormap);
    plt.tight_layout()
    plt.colorbar()
    plt.close(fig=fig)
    return fig

@pn.depends(colormap)
def reactive_plots(colormap):
    return plot(rndm, colormap)

pn.Column(selection_widget, reactive_plots).show()