Best Practices For Interactive Layouts

Here is the output of my interactive component:

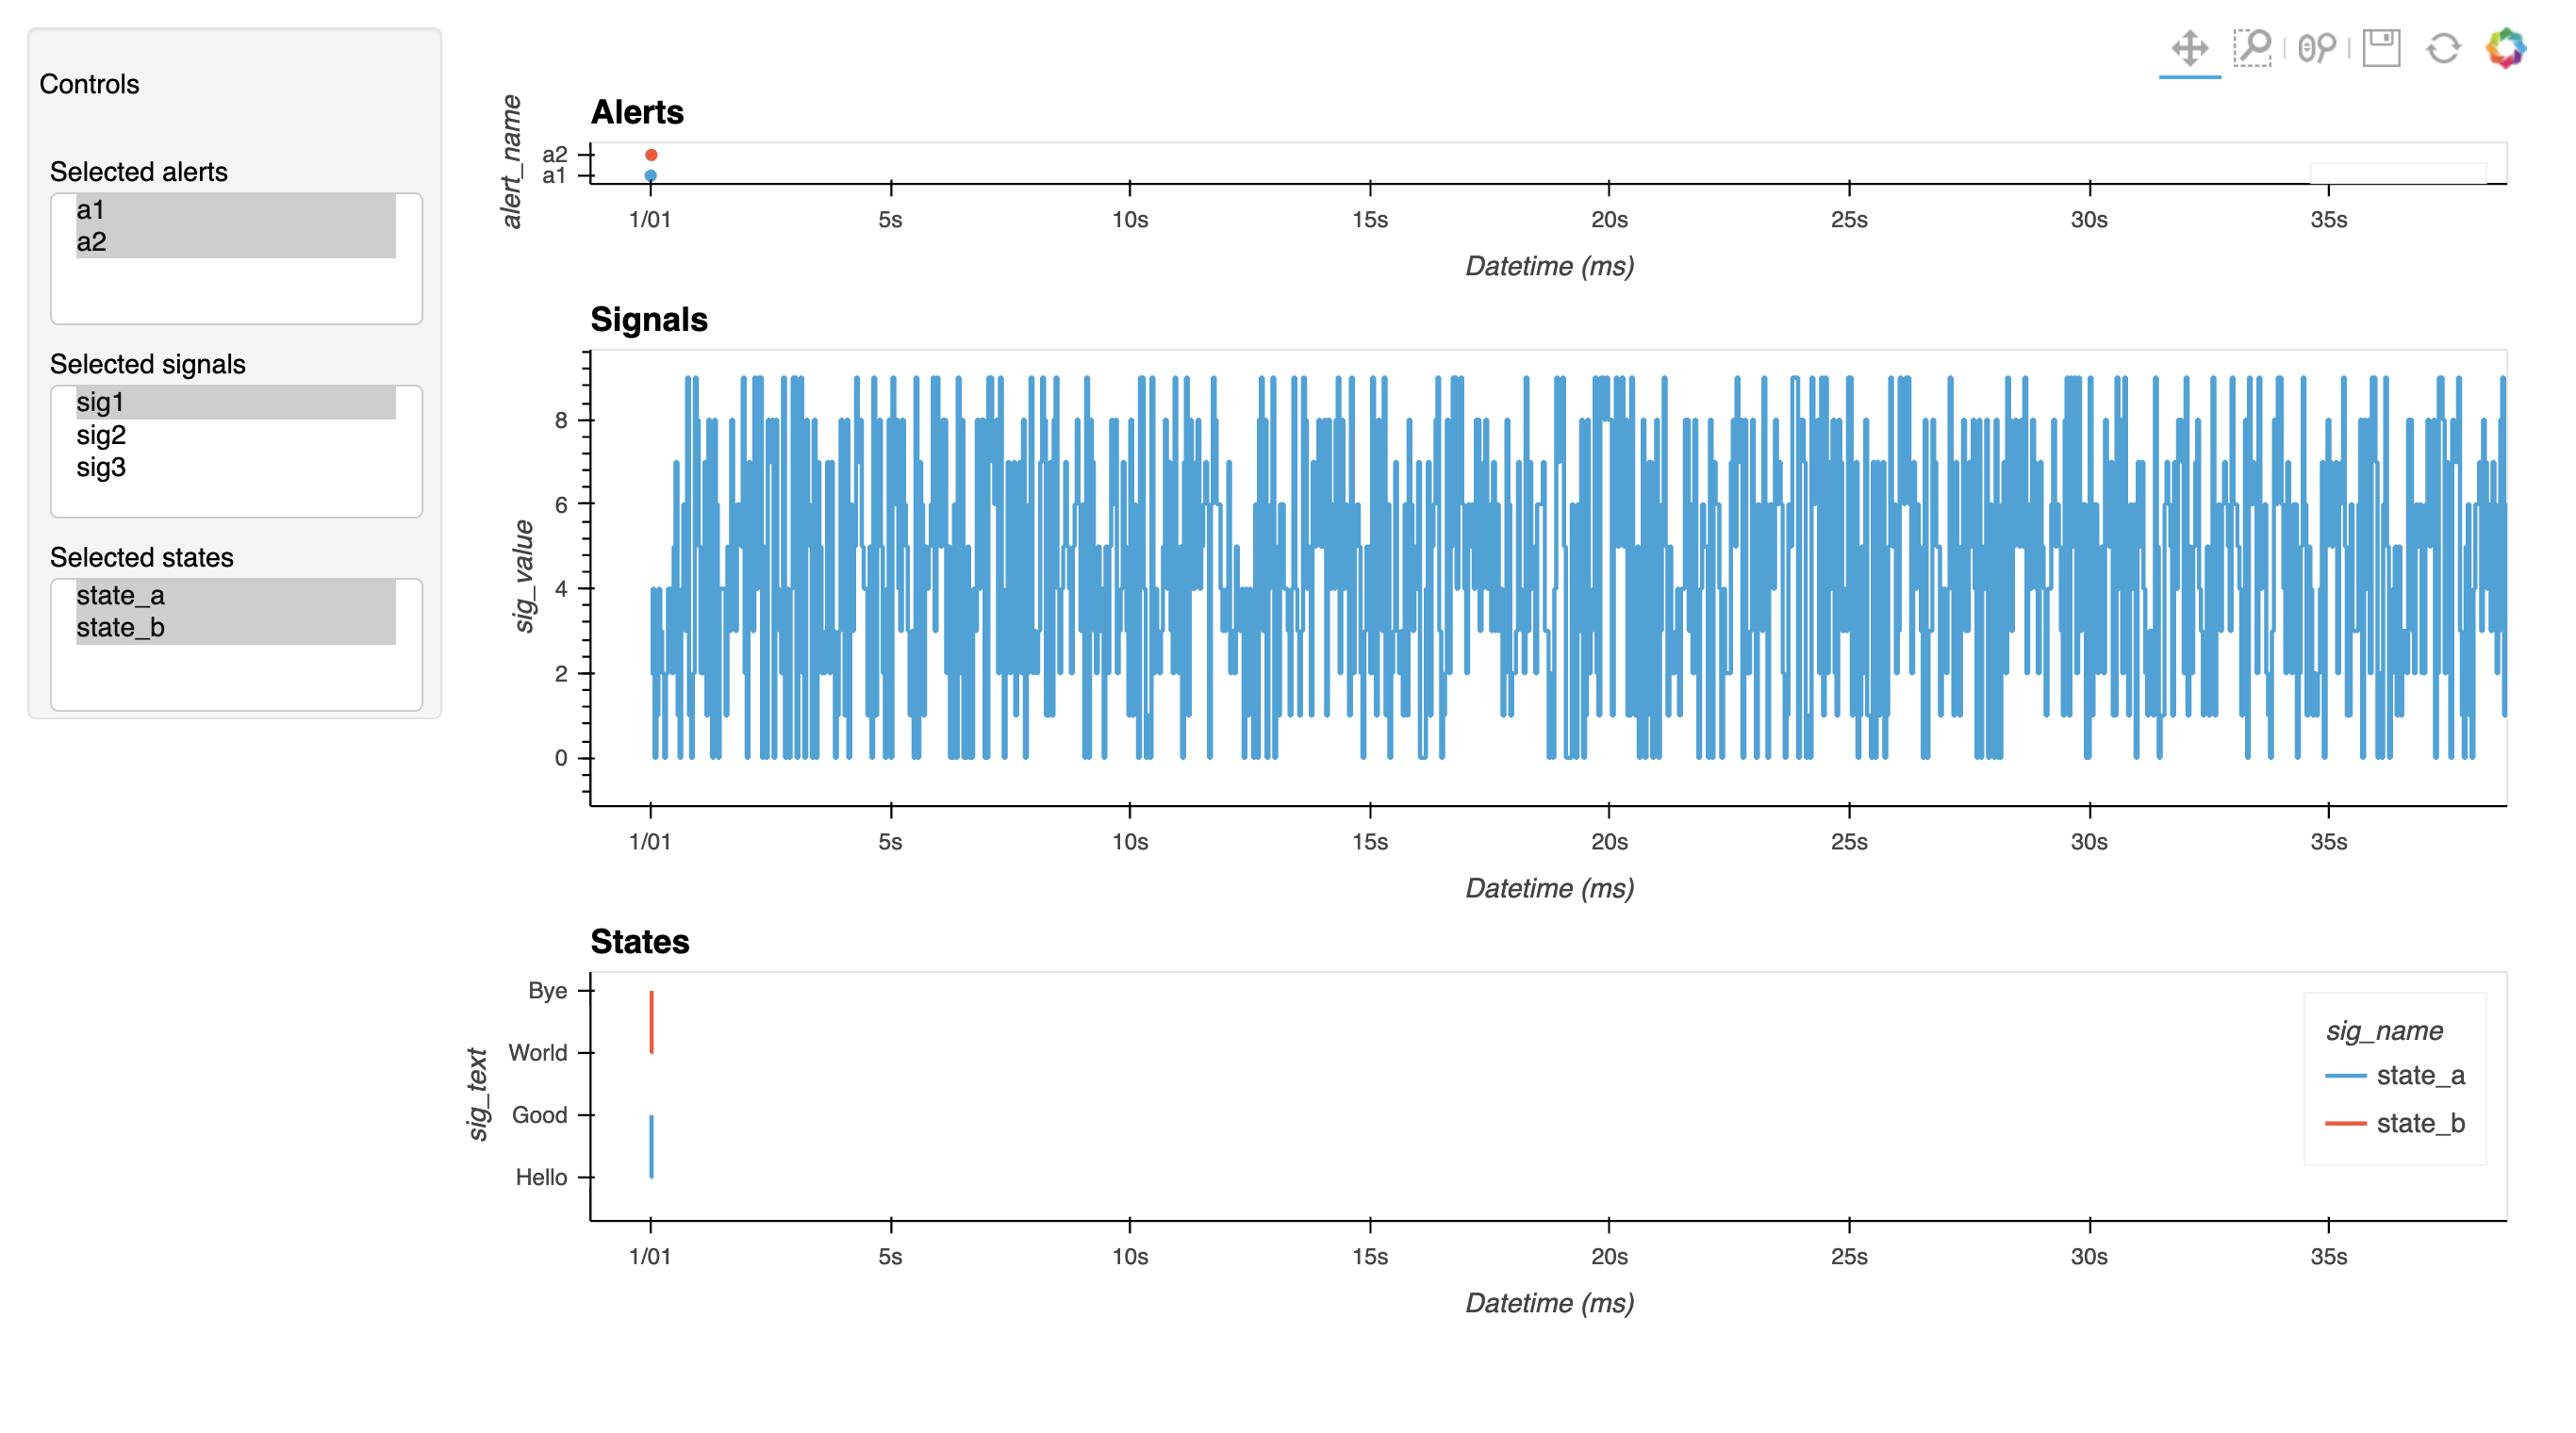
It’s still a little rough around the edges, but before I dive into the details, I’d like to know if this GENERAL approach is the correct (most performant) way to use HoloViews:

"""EventWindow can logs visualized"""
import pandas as pd
import numpy as np
import param
import holoviews as hv
from holoviews import opts
import panel as pn
import hvplot.pandas #noqa

class EventWindowViewer(pn.viewable.Viewer):
    """Display Interactive EventWindows"""
    
    df = param.DataFrame(pd.DataFrame())
    
    selected_alerts = param.ListSelector(default=[])
    selected_signals = param.ListSelector(default=[])
    selected_states = param.ListSelector(default=[])
    
    def __init__(self, **params):
        super().__init__(**params)
        
        self._layout = pn.Row(
            pn.WidgetBox(
                'Controls',
                self.param.selected_alerts,
                self.param.selected_signals,
                self.param.selected_states,
                width=200,
                sizing_mode='fixed',
            ),
            self.get_plot,
        )
    
    @param.depends('df', watch=True, on_init=True)
    def _prepare_df(self):
        """Add _time column, add sig_type column, sort by time"""
        self.df['_time'] = pd.to_datetime(self.df['epoch_ms'], unit='ms')
        self.df = self.df.sort_values(by=['_time'])
        
        def classify_sig_type(row):
            """Classify sig_name into `state`, `signal`, `alert` """

            if row['alert_name'] == None:
                if 'state' in row['sig_name']:
                    return 'state'
                else:
                    return 'signal'
            else:
                return 'alert'

        self.df['sig_type'] = self.df.apply(classify_sig_type, axis=1)
        
    @param.depends('df', watch=True, on_init=True)
    def _prepare_selectors(self):
        """Set the options for the signal, state, alert selectors"""
        self.param.selected_alerts.objects = list(self.df[self.df['sig_type'] == 'alert']['alert_name'].unique())
        self.param.selected_signals.objects = list(self.df[self.df['sig_type'] == 'signal']['sig_name'].unique())
        self.param.selected_states.objects = list(self.df[self.df['sig_type'] == 'state']['sig_name'].unique())
    
    @param.depends('df', watch=True, on_init=True)
    def _prepare_ds(self):
        """Annotate the data, set view options"""
        kdims = [
            hv.Dimension('_time', label='Datetime', unit='ms'),
            hv.Dimension('sig_type', label='Signal Type', values=['state', 'signal', 'alert'])
        ]

        ds = hv.Dataset(self.df, kdims=kdims+['sig_name'], vdims=['sig_value', 'alert_name', 'sig_text'])
        
        self.alerts = ds.select(sig_type='alert')\
            .to(hv.Scatter, '_time', 'alert_name').overlay('sig_name').collate(drop=['sig_type'])
        self.signals = ds.select(sig_type='signal')\
            .to(hv.Curve, '_time', 'sig_value').overlay('sig_name').collate(drop=['sig_type'])
        self.states = ds.select(sig_type='state')\
            .to(hv.Curve, '_time', 'sig_text').overlay('sig_name').collate(drop=['sig_type'])

        # style
        curve_opts = opts.Curve(interpolation='steps-post', width=1000)
        self.alerts.opts(
            opts.Scatter(height=100, width=1000, size=5, ), opts.NdOverlay(title='Alerts')
        )
        self.states.opts(
            curve_opts, opts.Curve(height=200), opts.NdOverlay(title='States'),
        )
        self.signals.opts(
            curve_opts, opts.NdOverlay(title='Signals', legend_position='top'),
        )
        
    @param.depends('selected_signals', 'selected_states')
    @pn.io.profile('get_plot', engine='snakeviz')
    def get_plot(self):
        return hv.Layout(
            self.alerts + 
            self.signals.select(sig_name=self.selected_signals) + 
            self.states.select(sig_name=self.selected_states)
        ).cols(1)
    
    def __panel__(self):
        return self._layout

d = {
    'epoch_ms': [],
    'sig_name': [],
    'alert_name': [],
    'sig_text': [],
    'sig_value': [],
}
for epoch in range(0, 40000, 40):
    for sig in ['sig1', 'sig2', 'sig3']:
        d['epoch_ms'].append(epoch)
        d['sig_name'].append(sig)
        d['alert_name'].append(None)
        d['sig_text'].append(None)
        d['sig_value'].append(np.random.randint(0, 10))
        
d['epoch_ms'].extend([2,          5,        15,         17, 19, 20])
d['sig_name'].extend(['alert_1', 'state_a', 'state_b', 'alert_2', 'state_a', 'state_b'])
d['alert_name'].extend(['a1',     None,      None,      'a2', None, None])
d['sig_text'].extend([None,       'Hello',   'World',    None, 'Good', 'Bye'])
d['sig_value'].extend([1,           None,     None,      2, None, None])

EventWindowViewer(df=pd.DataFrame(d)).servable()

I’m asking because I’m noticing an unfortunate amount of delay between the widget selections and the plots re-rendering. My company has an older, similar app using raw Bokeh which seems to be faster. I’m hoping that we can “upgrade” to holoviews, but if the app is significantly slower that’s a tough sell.

Am I doing anything here that is obviously slowing things down? What kind of restructuring might speed things up? Are there any best practices that I’m violating?

Note that I care less about initialization time than I do about interactive re-rendering time :slight_smile:

Thank you in advance for any suggestions

P.S., is there any way to share a vertical CrossHairTool between all three plots??

I would recommend

  • Simplifying the code by moving the basic transformation out of the class.
  • Separating the plot functions. It seems the plots each depend on max one parameter. So depending on multiple will only slow it down.
  • Maybe switch from Holoviews to hvPlot. hvPlot is the recommended entrypoint to the Holoviz ecosystem. I did not do it here.
  • Maybe add caching if you experience some slowness.
  • Maybe let HoloViews or hvPlot add the widgets. The current implementation is for users who like to work with Param and Panel. A HoloViews or hvPlot only approach could be taken.
  • Wrap the plots in a HoloMap or DynamicMap if technically possible as these provide caching/ speed ups.

Regarding the performance. I don’t see any issues. So please be more specific.

"""EventWindow can logs visualized"""
import pandas as pd
import numpy as np
import param
import holoviews as hv
from holoviews import opts
import panel as pn
import hvplot.pandas #noqa

curve_opts = opts.Curve(interpolation='steps-post', width=1000)

def extract_data()->pd.DataFrame:
    # This is slow and could be generated much faster. But I guess is just an example
    d = {
        'epoch_ms': [],
        'sig_name': [],
        'alert_name': [],
        'sig_text': [],
        'sig_value': [],
    }
    for epoch in range(0, 40000, 40):
        for sig in ['sig1', 'sig2', 'sig3']:
            d['epoch_ms'].append(epoch)
            d['sig_name'].append(sig)
            d['alert_name'].append(None)
            d['sig_text'].append(None)
            d['sig_value'].append(np.random.randint(0, 10))
            
    d['epoch_ms'].extend([2,          5,        15,         17, 19, 20])
    d['sig_name'].extend(['alert_1', 'state_a', 'state_b', 'alert_2', 'state_a', 'state_b'])
    d['alert_name'].extend(['a1',     None,      None,      'a2', None, None])
    d['sig_text'].extend([None,       'Hello',   'World',    None, 'Good', 'Bye'])
    d['sig_value'].extend([1,           None,     None,      2, None, None])
    
    return pd.DataFrame(d)

def transform_data(data: pd.DataFrame)->pd.DataFrame:
    """Add _time column, add sig_type column, sort by time"""
    # Never use .apply if you can aovid it. Its slow
    
    df = data.copy()
    df['_time'] = pd.to_datetime(df['epoch_ms'], unit='ms')
    df['sig_type']='NA'
    df = df.sort_values(by=['_time'])

    alert_name_is_none = df['alert_name'].isnull()
    signame_contains_state = df['sig_name'].str.contains("state")
    
    df.loc[~alert_name_is_none,'sig_type']='alert'
    df.loc[(alert_name_is_none) & (signame_contains_state), 'sig_type']='state'
    df.loc[(alert_name_is_none) & (~signame_contains_state), 'sig_type']='signal'
    return df

class EventWindowViewer(pn.viewable.Viewer):
    """Display Interactive EventWindows"""
    
    df = param.DataFrame()
    ds = param.ClassSelector(class_=hv.Dataset)
    
    selected_alerts = param.ListSelector(default=[])
    selected_signals = param.ListSelector(default=[])
    selected_states = param.ListSelector(default=[])
    
    def __init__(self, **params):
        super().__init__(**params)
        
        self._layout = pn.Row(
            pn.WidgetBox(
                'Controls',
                self.param.selected_alerts,
                self.param.selected_signals,
                self.param.selected_states,
                width=200,
                sizing_mode='fixed',
            ),
            pn.Column(self.alerts, self.signals, self.states),
        )
    
    @param.depends('df', watch=True, on_init=True)
    def _prepare_selectors(self):
        """Set the options for the signal, state, alert selectors"""
        self.param.selected_alerts.objects = list(self.df[self.df['sig_type'] == 'alert']['alert_name'].unique())
        self.param.selected_alerts.default = [self.param.selected_alerts.objects[0]]
        self.param.selected_signals.objects = list(self.df[self.df['sig_type'] == 'signal']['sig_name'].unique())
        self.param.selected_signals.default = [self.param.selected_signals.objects[0]]
        self.param.selected_states.objects = list(self.df[self.df['sig_type'] == 'state']['sig_name'].unique())
        self.param.selected_states.default = [self.param.selected_states.objects[0]]
    
    @param.depends('df', watch=True, on_init=True)
    def _prepare_ds(self):
        """Annotate the data, set view options"""
        kdims = [
            hv.Dimension('_time', label='Datetime', unit='ms'),
            hv.Dimension('sig_type', label='Signal Type', values=['state', 'signal', 'alert'])
        ]

        self.ds = hv.Dataset(self.df, kdims=kdims+['sig_name'], vdims=['sig_value', 'alert_name', 'sig_text'])
        
    @pn.depends("ds")
    def alerts(self) -> hv.HoloMap:
        plot = (
            self.ds
            .select(sig_type='alert')
            .to(hv.Scatter, '_time', 'alert_name')
            .overlay('sig_name')
            .opts(
                opts.Scatter(height=300, width=1000, size=5, ), opts.NdOverlay(title='Alerts', legend_position="top")
            )
        )
        if len(plot)==0:
            return "No alerts detected"
        return plot

    @pn.depends("ds", "selected_signals")
    def signals(self) -> hv.HoloMap:
        plot = (
            self.ds
            .select(sig_type='signal', sig_name=self.selected_signals)
            .to(hv.Curve, '_time', 'sig_value')
            .overlay('sig_name')
            .opts(
                curve_opts, opts.NdOverlay(title='Signals', legend_position='top'),
            )
        )
        if len(plot)==0:
            return "No signals selected"
        return plot

    @pn.depends("ds", "selected_states")
    def states(self) -> hv.HoloMap:
        plot = (
            self.ds
            .select(sig_type='state', sig_name=self.selected_states)
            .to(hv.Curve, '_time', 'sig_text')
            .overlay('sig_name')
            .opts(
                curve_opts, opts.Curve(height=200), opts.NdOverlay(title='States'),
            )
        )
        if len(plot)==0:
            return "No states selected"
        return plot
    
    def __panel__(self):
        return self._layout

source_data = extract_data()
data = transform_data(source_data)

EventWindowViewer(df=data).servable()
3 Likes

Thanks for the feedback! I appreciate your time. To fully address each part of your response:

Simplifying the code by moving the basic transformation out of the class.

Fair.

Separating the plot functions. It seems the plots each depend on max one parameter. So depending on multiple will only slow it down.

Fair.

Maybe switch from Holoviews to hvPlot. hvPlot is the recommended entrypoint to the Holoviz ecosystem. I did not do it here.

I am aware :+1:. I have used hvPlot and ran into limitations so I wanted to practice my holoviews.

Maybe add caching if you experience some slowness.

Your implementation is sufficiently speedy for me, I assume the main speedup came from seperating the plotting function into three and just replacing the plot that was updated…

Maybe let HoloViews or hvPlot add the widgets. The current implementation is for users who like to work with Param and Panel. A HoloViews or hvPlot only approach could be taken.

I do like working with Panel and Param, especially since this component is going to be embedded inside a larger Panel app.

Wrap the plots in a HoloMap or DynamicMap if technically possible as these provide caching/ speed ups.

I was under the impression that the outputs were already HoloMaps casted into NdOverlays. It’s not clear to me what else I would have to do.

In Summary,

Thank you for providing the improved codebase, I think it will help my writing in the future. For this particular application, I don’t think I’ll be able to use this structure because I don’t see how to add a shared CrossHairTool which is quite important for seeing the time-series next to each other.

I suppose that once a set of plots become sufficiently customized/specific, it becomes necessary to implement the visualization using Bokeh. I can still use panel to make the bokeh plot respond to widget inputs

2 Likes