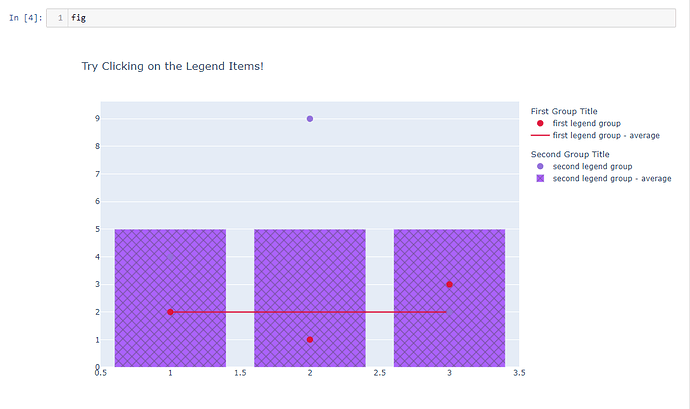
Hi! My ML/Data-science team codes analytical app in Panel framework. We also use plotly module to visualize our insights. However, we found out that some plotly functionalities do not cooperate with Panel. In the following code there is an example with grouped legend and pattern_shape in the bar graph.
It will be nice to see your suggestions to solve or understand this problem 
import plotly.graph_objects as go
import panel as pn

pn.extension('plotly')


# Plotly figure with grouped legend from https://plotly.com/python/legend/
fig = go.Figure()

fig.add_trace(go.Scatter(
    x=[1, 2, 3],
    y=[2, 1, 3],
    legendgroup="group",  # this can be any string, not just "group"
    legendgrouptitle_text="First Group Title",
    name="first legend group",
    mode="markers",
    marker=dict(color="Crimson", size=10)
))

fig.add_trace(go.Scatter(
    x=[1, 2, 3],
    y=[2, 2, 2],
    legendgroup="group",
    name="first legend group - average",
    mode="lines",
    line=dict(color="Crimson")
))

fig.add_trace(go.Scatter(
    x=[1, 2, 3],
    y=[4, 9, 2],
    legendgroup="group2",
    legendgrouptitle_text="Second Group Title",
    name="second legend group",
    mode="markers",
    marker=dict(color="MediumPurple", size=10)
))

fig.add_trace(go.Bar(
    x=[1, 2, 3],
    y=[5, 5, 5],
    legendgroup="group2",
    name="second legend group - average",
    marker = dict(pattern_shape='x')
))

fig.update_layout(
    title="Try Clicking on the Legend Items!",
    legend = dict(groupclick = 'toggleitem'),
    width=1000,
    height=600
)

# Figure is displayed correctly in notebook
# You can run it in another cell
pn.Row(fig)

# In Panel page the legend is malfuctioned and there's no pattern_shape
page = pn.template.BootstrapTemplate(title='test-page')
page.main.append(pn.Row(fig))
pn.serve({'test':page}, port=9987)
