I have the following notebook:
from bokeh.models import ColumnDataSource
from bokeh.plotting import figure
from bokeh.palettes import YlGn9

import panel as pn
import pandas as pd
import numpy as np

import math
pn.extension()


def add_heat_map_to_figure(fig: figure, df: DataFrame, colors: List, glyph_size: float) -> figure:
    mapper = LinearColorMapper(palette=colors, low=df.value.min(), high=df.value.max())
    return fig.rect(x="timestamp",
                    y='Tags',
                    width=glyph_size,
                    height=1,
                    source=df,
                    line_color=None,
                    fill_color={'field': 'value', 'transform': mapper})  # transform('value', mapper)


def add_binary_heat_map_to_figure(fig: figure, df: DataFrame, colors: List = None, glyph_size: float = 1) -> figure:
    _colors = colors or ["#474747", "#7fff00"]
    mapper = LinearColorMapper(palette=_colors, low=0, high=1)
    return fig.rect(x="timestamp",
                    y='Tags',
                    width=glyph_size,
                    height=1,
                    source=df,
                    line_color=None,
                    fill_color={'field': 'value', 'transform': mapper})

def create_range_tool(connected_chart: figure, columns: List, add_plot_to_figure: Callable,
                      theme: Dict) -> figure:
    plot_theme = theme.get('plot', {})
    col_num = len(columns)
    plot_height = 50 * col_num
    # Create a figure
    select_fig = figure(title="Drag the middle and edges of the selection box to change the range above",
                        plot_height=plot_height,
                        y_range=columns,
                        x_axis_type="datetime",
                        x_axis_location="above",
                        tools="hover",
                        **plot_theme)

    # Add range tool to figure
    range_tool = RangeTool(x_range=connected_chart.x_range)
    range_tool.overlay.fill_color = "navy"
    range_tool.overlay.fill_alpha = 0.2

    select_fig.add_tools(range_tool)

    # Add plotting to figure
    add_plot_to_figure(select_fig)

    select_fig.x_range.range_padding = 0
    select_fig.outline_line_color = None
    select_fig.sizing_mode = 'stretch_width'
    select_fig.ygrid.grid_line_color = None
    select_fig.toolbar.active_multi = range_tool
    return select_fig, range_tool


minutes_in_month = 44200
sample_rate = 200
sample_rates_in_month = math.ceil(minutes_in_month / sample_rate)
four_weeks = max(len(cols) * sample_rates_in_month, 1)
one_month_dff = dff.loc[0:four_weeks].copy()

dates = one_month_dff.timestamp.values
glyph_size = 200*60*1000

fig = figure(x_axis_type="datetime", y_range=cols, x_range=(dates[0], dates[-1]), sizing_mode = 'stretch_width', tools="hover")
fig.outline_line_color = None

main_source = ColumnDataSource(one_month_dff)

add_binary_heat_map_to_figure(fig, main_source, glyph_size=glyph_size)

def add_to_figure(fig):
    return add_heat_map_to_figure(fig, header_dff, YlGn9, 604800000)


def to_time(time):
    if isinstance(time, float):
        return pd.Timestamp(time, unit='ms').replace(microsecond=0)
    return pd.Timestamp(time).replace(microsecond=0)

def update_chart(e):
    s, e = to_time(range_tool.x_range.start), to_time(range_tool.x_range.end)
    _start, _end = one_month_dff.iloc[[0, -1]].timestamp
    start = min(s, _start)
    end = max(e, _end)
    new_dff = dff[(dff.timestamp >= start) & (dff.timestamp <= end)]
    main_source.stream(new_dff)


f, range_tool = create_range_tool(fig, _cols, add_to_figure, {})
button = pn.widgets.Button(name='update')
button.on_click(update_chart)

pn.Column(button, f,fig, sizing_mode="scale_width")
Which generates:
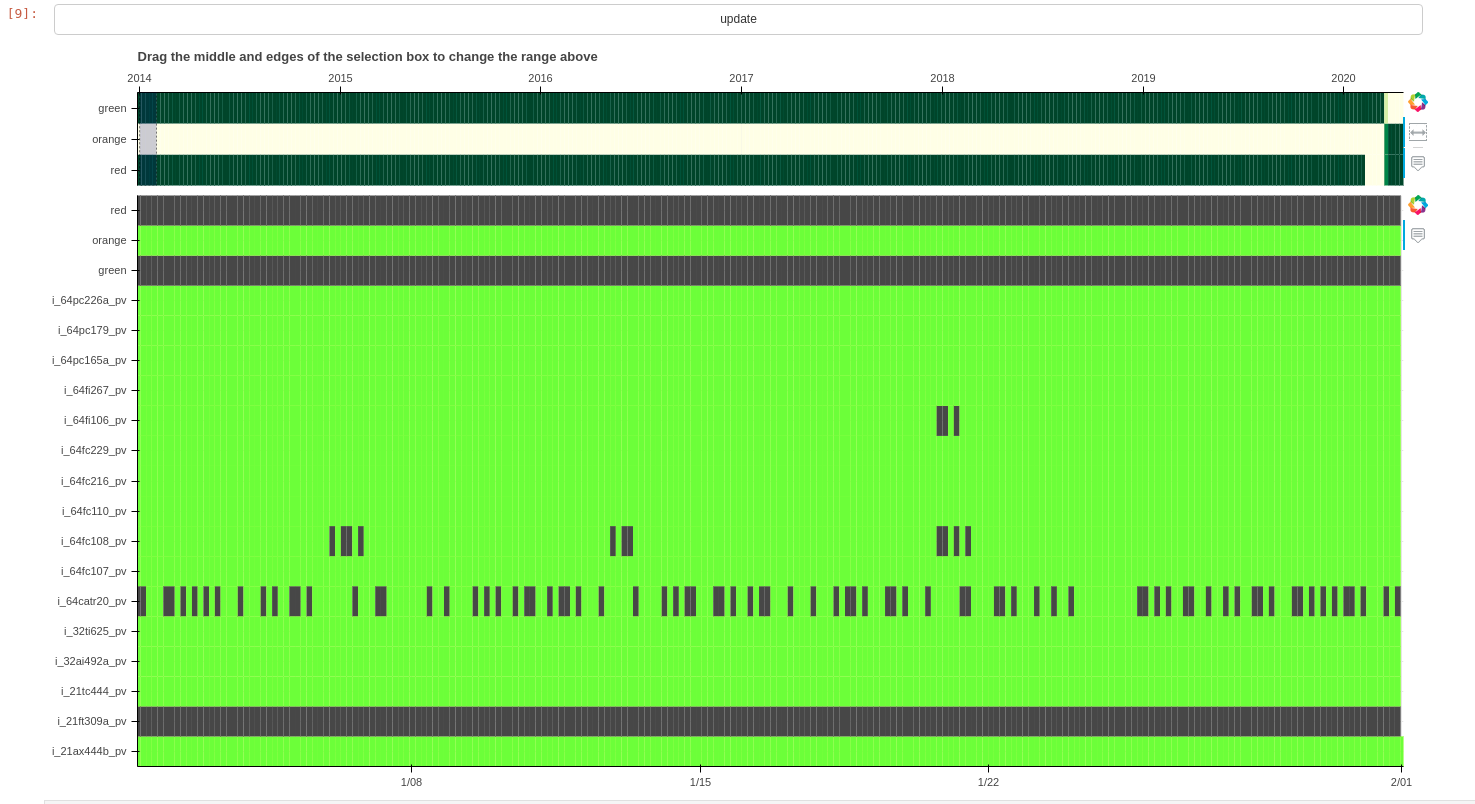
Now, the following area in the code should stream data to the bottom heatmap on click.
But it is not.
def update_chart(e):
    s, e = to_time(range_tool.x_range.start), to_time(range_tool.x_range.end)
    _start, _end = one_month_dff.iloc[[0, -1]].timestamp
    start = min(s, _start)
    end = max(e, _end)
    new_dff = dff[(dff.timestamp >= start) & (dff.timestamp <= end)]
    main_source.stream(new_dff)
System:
bokeh==2.2.1
jupyter-bokeh==2.0.2
panel==0.10.0a18
Any idea what am i doing wrong?
Thanks in advance