Bokeh/hv support for a tighter layout

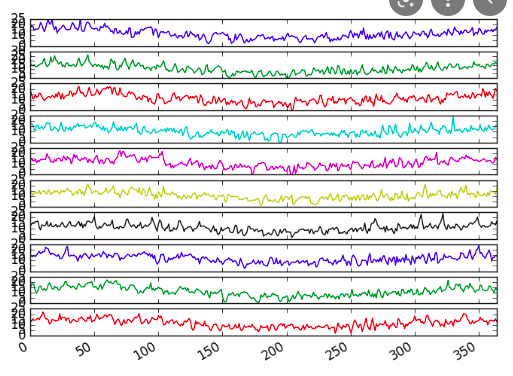
For the sake of clarity, imagine a visualization where we plot different time series, each belonging to one channel, versus time. The figure layout should have one column (all time series share the x axis but they are in different plots) and as many rows as the number of channels.

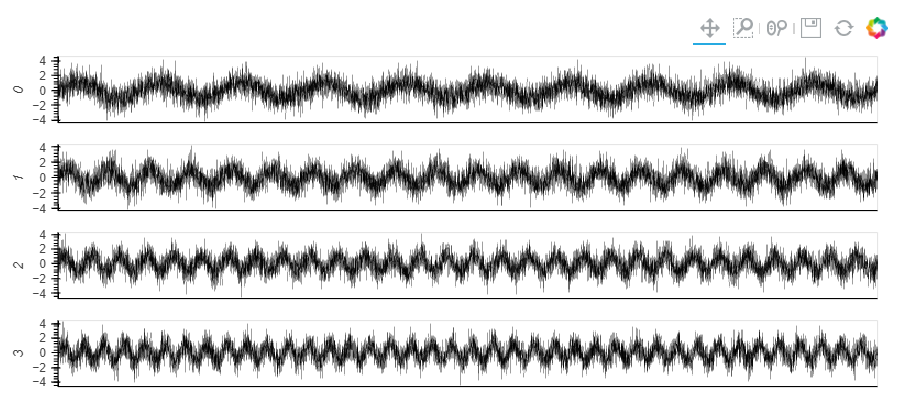
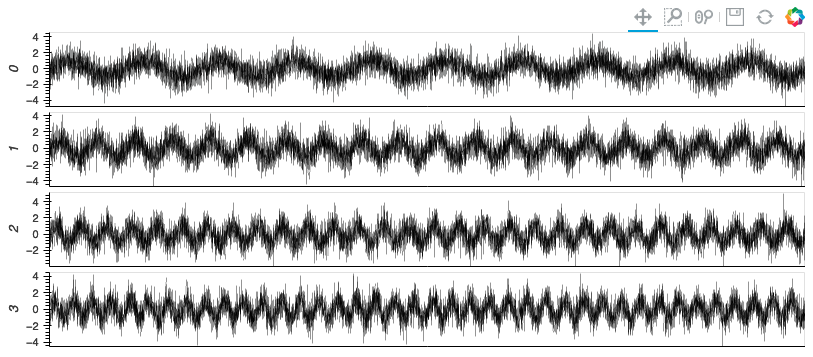
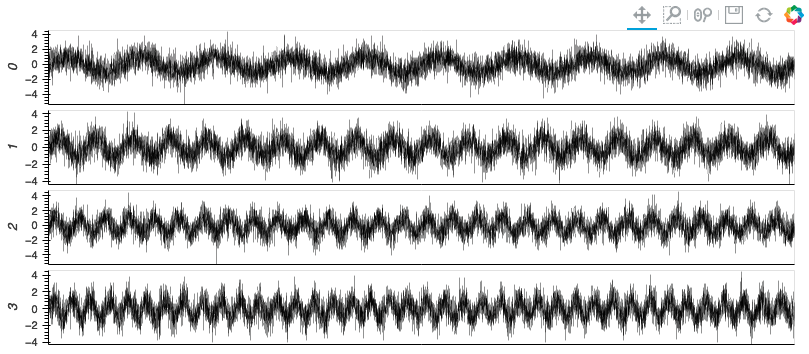
I haven’t been able to find a way with the bokeh extension in which to design a proper layout where you can adjust the space between between the row suplots, as you could do with plt.tight_layout() or plt.subplots_adjust() in matplotlib.

I have tried using panel rows, GridSpec and Layout but nothing seems to solve the problem. All I could do was to just share the x axis and only display the xticklabels in the last row but I wasn’t able to modify the space between subplots.

What should be the best approach to take? Is there any argument that I am missing? Is this available or needs to be requested as a feature?

I would like to have something like this but being able to control the vertical space between the rows:

image

Do you have a screenshot of what it looks like with Bokeh plots?

Dear @maximlt

Yes, please find it below:

The thing here is that I would like to remove the vertical space between subplots. This example is with hv.Layout, but using Panel and GridStack, the same happens.

To reproduce the example, find the code below:

import numpy as np
import pandas as pd
import holoviews as hv
from holoviews.operation.datashader import datashade, shade, dynspread, spread

hv.extension('bokeh')

df = pd.DataFrame({
    'x':np.linspace(0, 10, 10*1000), 
    'y0': np.sin(2*np.pi*1*np.linspace(0, 10, 10*1000)) + np.random.normal(loc=0, scale=1, size=10*1000), 
    'y1': np.sin(2*np.pi*2*np.linspace(0, 10, 10*1000)) + np.random.normal(loc=0, scale=1, size=10*1000), 
    'y2': np.sin(2*np.pi*3*np.linspace(0, 10, 10*1000)) + np.random.normal(loc=0, scale=1, size=10*1000), 
    'y3': np.sin(2*np.pi*4*np.linspace(0, 10, 10*1000)) + np.random.normal(loc=0, scale=1, size=10*1000)})

hv.Layout([datashade(hv.Curve((df['x'], df['y'+str(i)]), kdims=' ', vdims=str(i)), cmap='black').opts(width=800, height=80, xaxis='bare') for i in range(4)]).cols(1)

Thanks!

Found it! You have to pass border=0 (or whatever value suits you, the default being 10 pixels)

hv.Layout(
    [
        datashade(
            hv.Curve((df['x'], df['y'+str(i)]), kdims=' ', vdims=str(i)), cmap='black'
        ).opts(width=800, height=80, xaxis='bare', border=0)
        for i in range(4)
    ]
).cols(1)

I don’t think it’s documented in the website but you can find it by running hv.help(hv.Curve) in a notebook, although that requires a little bit of digging in the long help text returned! Looking at the code I see it affects the min_border_ styling properties of the Bokeh plot.

Note that if this is not exactly what you wanted, or if you want to customize even further a plot with options not exposed by HoloViews, you can still register function hooks that give you access to the plot object of the underlying library.

def hook__bokeh_no_top_bottom_border(plot, element):
    plot.state.min_border_top = 0
    plot.state.min_border_bottom = 0

hv.Layout(
    [
        datashade(
            hv.Curve((df['x'], df['y'+str(i)]), kdims=' ', vdims=str(i)), cmap='black'
        ).opts(width=800, height=80, xaxis='bare', hooks=[hook__bokeh_no_top_bottom_border])
        for i in range(4)
    ]
).cols(1)

2 Likes

Dear @maximlt , that is exactly what I was looking for. I’ll try using the hook functions to better adjust the plot that I wanted, but this solves the problem. Thanks a lot!

2 Likes