For df, I wish to produce an interactive box plot showing the distribution of all numeric attributes, represented as seperate subplots.
In [2]: import pandas as pd
   ...: import numpy as np
   ...: import holoviews as hv
   ...: import hvplot.pandas # noqa
   ...: import feather
   ...: hv.extension("bokeh","plotly")
In [4]: df.head()
Out[4]:
   area error  compactness error  concave points error  concavity error  fractal dimension error  mean area  mean compactness  ...  worst concavity  worst fractal dimension  worst perimeter  worst radius  worst smoothness  worst symmetry  worst texture
0      153.40            0.04904               0.01587          0.05373                 0.006193     1001.0           0.27760  ...           0.7119                  0.11890           184.60         25.38            0.1622          0.4601          17.33
1       74.08            0.01308               0.01340          0.01860                 0.003532     1326.0           0.07864  ...           0.2416                  0.08902           158.80         24.99            0.1238          0.2750          23.41
2       94.03            0.04006               0.02058          0.03832                 0.004571     1203.0           0.15990  ...           0.4504                  0.08758           152.50         23.57            0.1444          0.3613          25.53
3       27.23            0.07458               0.01867          0.05661                 0.009208      386.1           0.28390  ...           0.6869                  0.17300            98.87         14.91            0.2098          0.6638          26.50
4       94.44            0.02461               0.01885          0.05688                 0.005115     1297.0           0.13280  ...           0.4000                  0.07678           152.20         22.54            0.1374          0.2364          16.67

[5 rows x 32 columns]
In [8]: df.info()
<class 'pandas.core.frame.DataFrame'>
RangeIndex: 569 entries, 0 to 568
Data columns (total 32 columns):
 #   Column                   Non-Null Count  Dtype
---  ------                   --------------  -----
 0   area error               569 non-null    float64
 1   compactness error        569 non-null    float64
 2   concave points error     569 non-null    float64
 3   concavity error          569 non-null    float64
 4   fractal dimension error  569 non-null    float64
 5   mean area                569 non-null    float64
 6   mean compactness         569 non-null    float64
 7   mean concave points      569 non-null    float64
 8   mean concavity           569 non-null    float64
 9   mean fractal dimension   569 non-null    float64
 10  mean perimeter           569 non-null    float64
 11  mean radius              569 non-null    float64
 12  mean smoothness          569 non-null    float64
 13  mean symmetry            569 non-null    float64
 14  mean texture             569 non-null    float64
 15  perimeter error          569 non-null    float64
 16  radius error             569 non-null    float64
 17  smoothness error         569 non-null    float64
 18  symmetry error           569 non-null    float64
 19  target                   569 non-null    int64
 20  target_name              569 non-null    category
 21  texture error            569 non-null    float64
 22  worst area               569 non-null    float64
 23  worst compactness        569 non-null    float64
 24  worst concave points     569 non-null    float64
 25  worst concavity          569 non-null    float64
 26  worst fractal dimension  569 non-null    float64
 27  worst perimeter          569 non-null    float64
 28  worst radius             569 non-null    float64
 29  worst smoothness         569 non-null    float64
 30  worst symmetry           569 non-null    float64
 31  worst texture            569 non-null    float64
dtypes: category(1), float64(30), int64(1)
memory usage: 138.6 KB
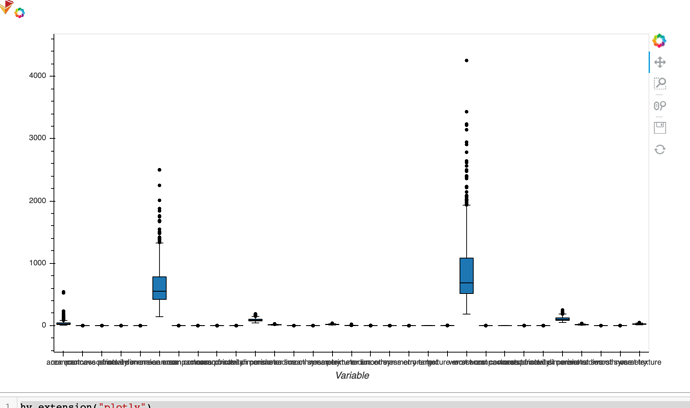
If I use the Bokeh backend then the plot successfully produces, although it is not interactive:
In [5]: hv.extension("bokeh")
   ...: df.hvplot.box(subplots=True,
   ...:               shared_axes=False,
   ...:               height=500,width=900)
Also, subplots=True does not appear to have an effect on the plot. I have also experienced this issue for hvplot.kde(), but I have successfully used this attribute with hvplot.hist(). (I have raised a seperate issue about this.)
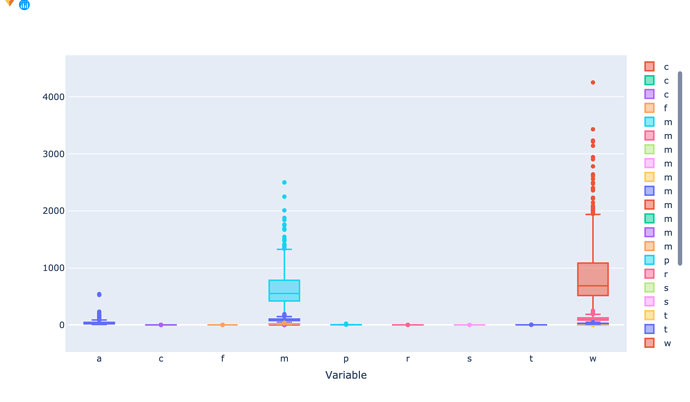
If I switch to the Plotly backend then my plot produces, however, the attribute names have been truncated to a single letter, many of which are not unique, hence my box plots end up stacked on top of each other:
In [6]: hv.extension("plotly")
   ...: df.hvplot.box(subplots=True,
   ...:               shared_axes=False,
   ...:               height=500,width=900)
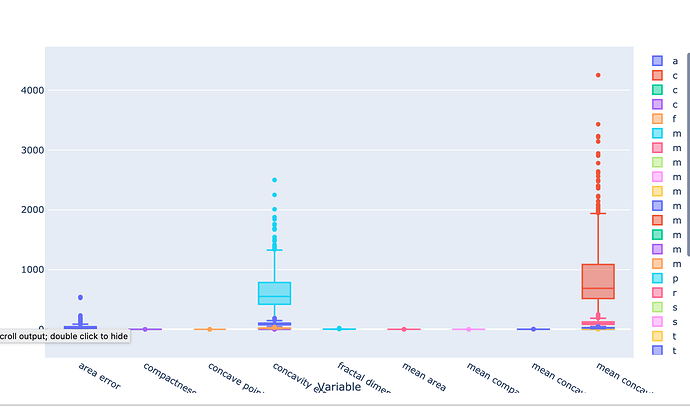
I was successfully able to rename some attributes based on index position, however it seems like the non unique letter version of attribute names still causes an issue:
In [7]: hv.extension("plotly")
   ...: plot = df.hvplot.box(subplots=True,
   ...:                      shared_axes=False,
   ...:                      height=500,width=900)
   ...:
   ...: plot.opts(xticks=[(0,'area error'), (1,'compactness error'), (2,'concave points error'),
   ...:        (3,'concavity error'), (4,'fractal dimension error'), (5,'mean area'),
   ...:        (6,'mean compactness'), (7,'mean concave points'), (8,'mean concavity'),
   ...:        (9,'mean fractal dimension'), (10,'mean perimeter'), (11,'mean radius'),
   ...:        (12,'mean smoothness'), (13,'mean symmetry'), (14,'mean texture'), (15,'perimeter error'),
   ...:        (16,'radius error'), (17,'smoothness error'), (18,'symmetry error'), (19,'target'),
   ...:        (20,'target_name'), (21,'texture error'), (22,'worst area'), (23,'worst compactness'),
   ...:        (24,'worst concave points'), (25,'worst concavity'), (26,'worst fractal dimension'),
   ...:        (27,'worst perimeter'), (28,'worst radius'), (29,'worst smoothness'), (30,'worst symmetry'),
   ...:        (31,'worst texture')])
My ultimate aim would be to produce a box plot for all numeric attributes and have each box plot in its own subplot.
Any advice how to solve this issue would be greatly appreciated.
Thanks.
Software Versions:
pandas                    1.0.3            py37h6c726b0_0
numpy                     1.18.1           py37h7241aed_0
holoviews                 1.13.1                     py_0    pyviz
hvplot                    0.5.2                      py_0    pyviz
feather-format            0.4.0                   py_1003    conda-forge
bokeh                     1.4.0                    py37_0
plotly                    4.5.4                      py_0    plotly


