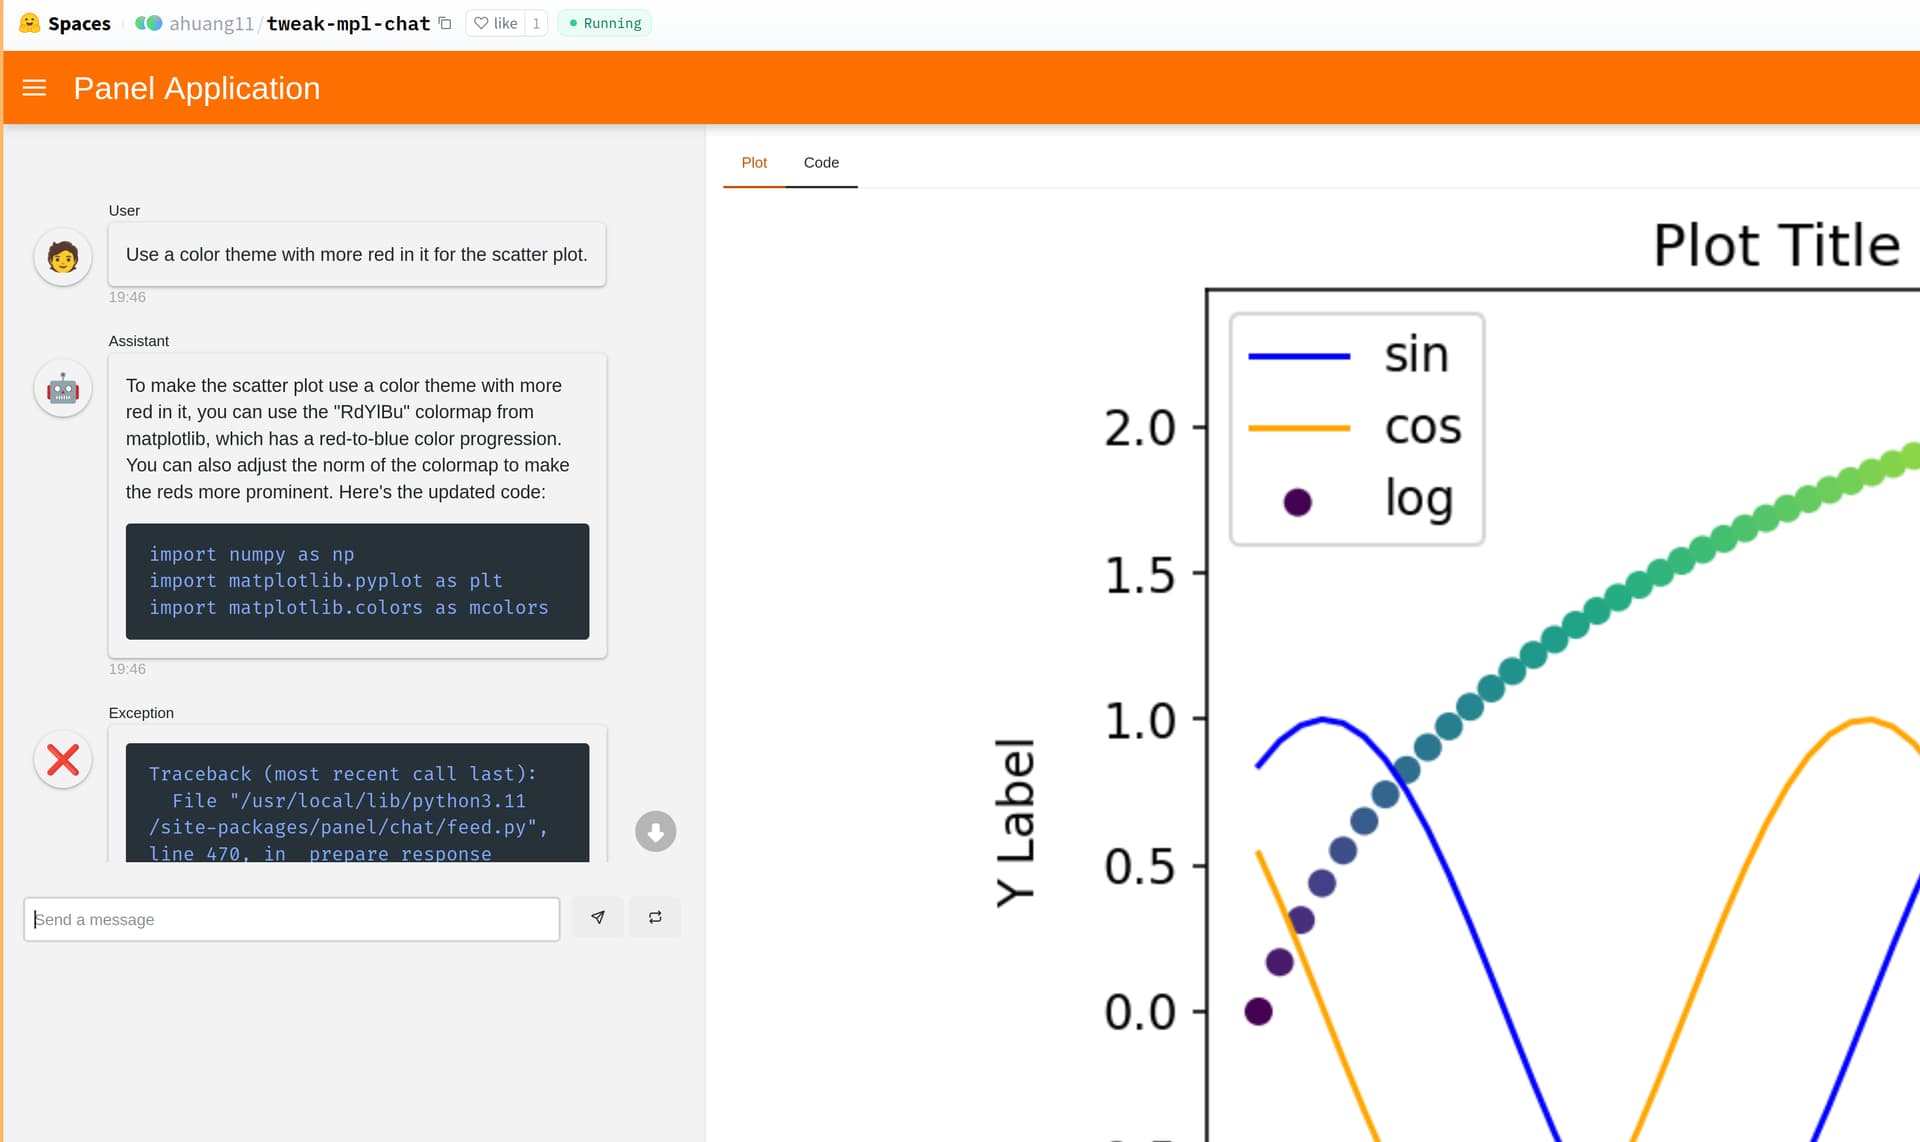
Have you wasted hours tweaking a plot for a presentation or academic paper, like searching StackOverflow on how to change the font size of the labels? The future is now; let LLMs improve your plots for you!
Have you wasted hours tweaking a plot for a presentation or academic paper, like searching StackOverflow on how to change the font size of the labels? The future is now; let LLMs improve your plots for you!
This is great !
But it doesn’t seem like the plot gets updated all the time when the code changes
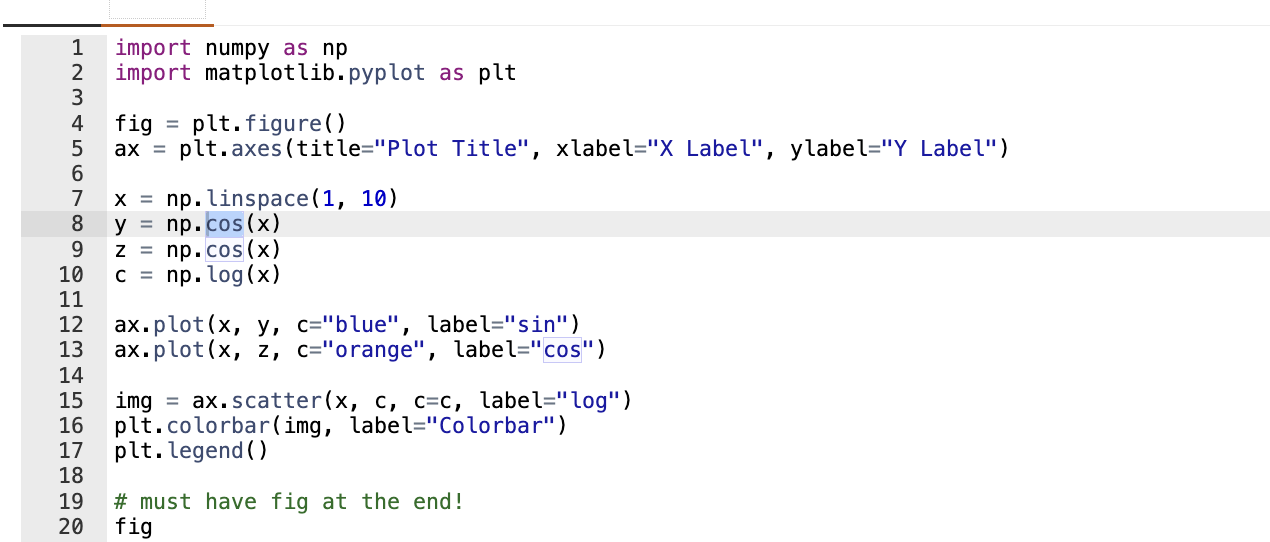
I changed the code to be
fig = plt.figure()
ax = plt.axes(title="Plot Title", xlabel="X Label", ylabel="Y Label")

x = np.linspace(1, 10)
y = np.cos(x)  # Change this line to update the plot
z = np.cos(x)
c = np.log(x)

ax.plot(x, y, c="blue", label="sin")
ax.plot(x, z, c="orange", label="cos")
ax.plot(x, c, c="green", label="log")

plt.colorbar(label="Colorbar")
plt.legend()

fig
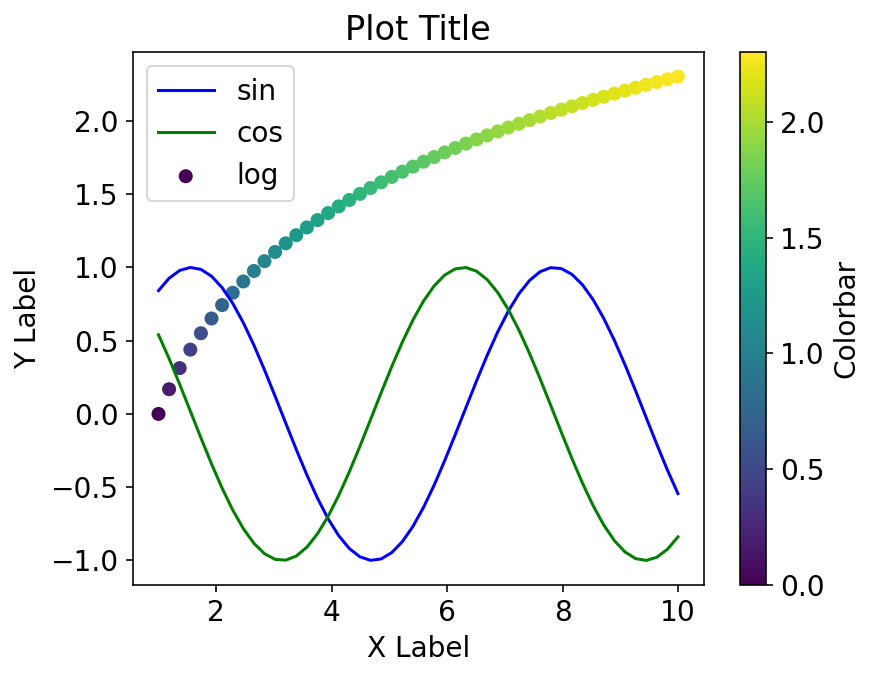
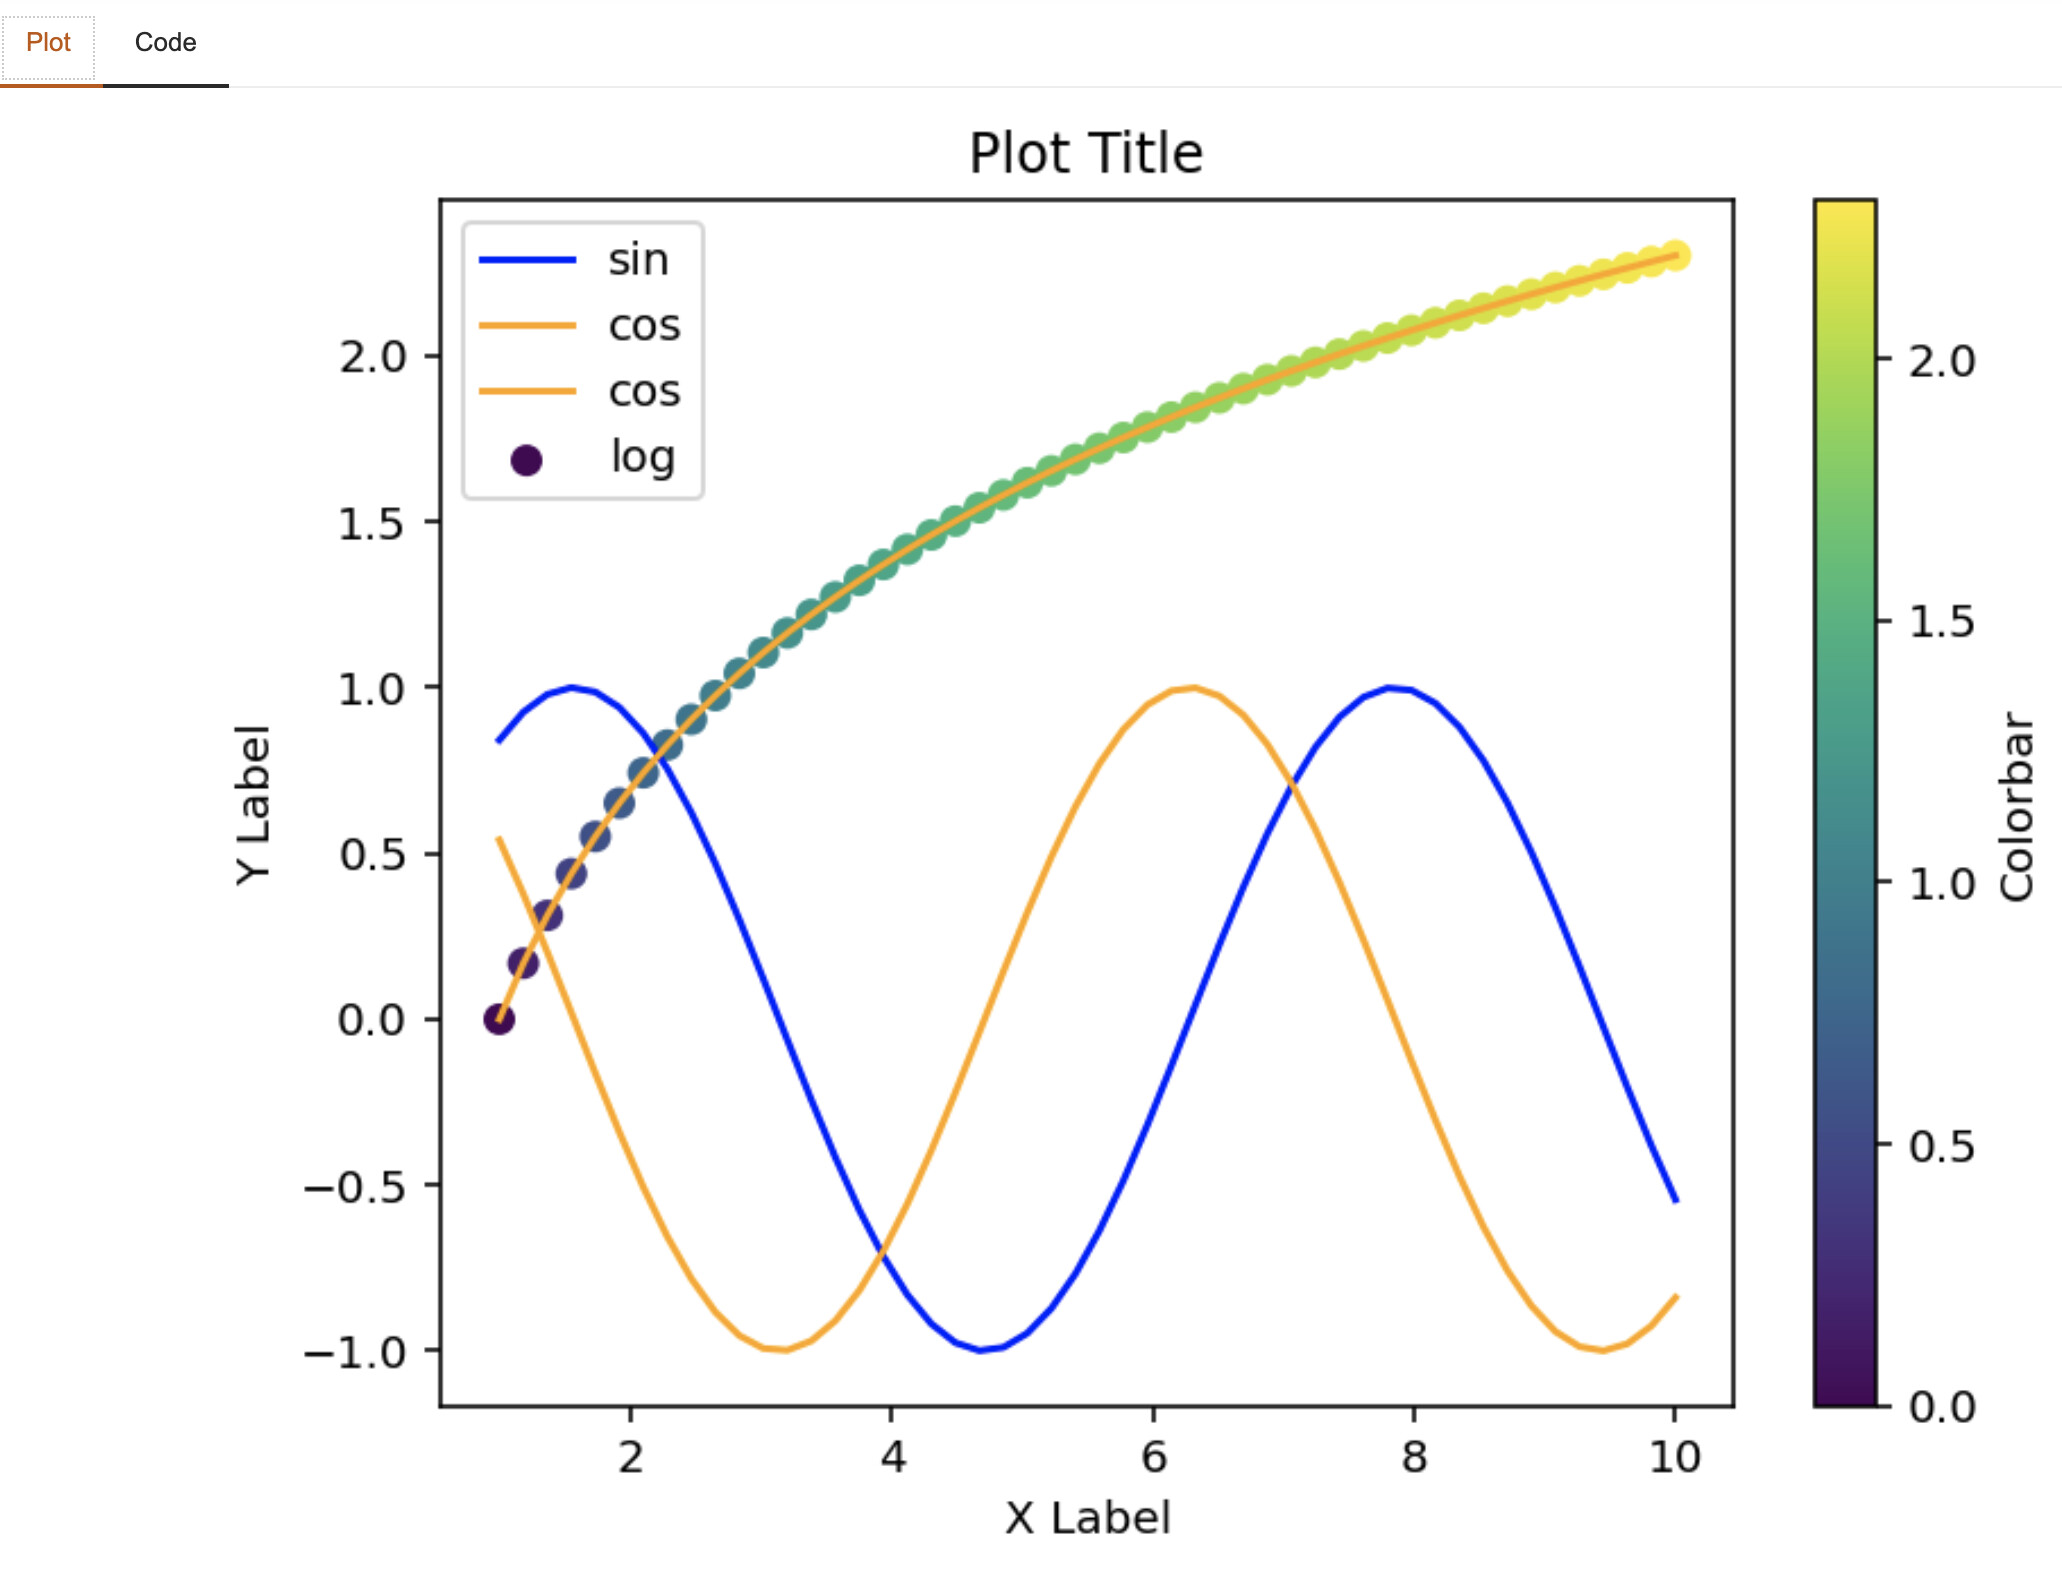
But the plot still looks like this
What am I doing wrong?
Thanks
Hi @ahuang11,
I have the same issue I don’t have much information other than I was trying the app on huggin face with edge on a windows laptop. Refreshing I end up with same result but does restore to default, I can see the code updates, I get a friendly message of what it’s going to change but errors out when trying to run the code changes, nothing wrong with the code because just changed the x limiter to provide more padding
I can provide a little update works on my iPhone. Using google chrome
I suspect Huggingface is sharing sessions. Can you try running the app locally?
Also, can you share with me your queries to the LLM?