Call `.servable()` on a Pane object vs call `.servable()` on a Template object

Hi there,

I was trying the last example shown here: Plotly — Panel v0.13.1 with two different .servable() methods mentioned in the title, and found the inconsistent rendering pattern, so I am wondering what’s the difference, and what’s the better practice?

  • Example 1: Call .servable() on a Pane object
import panel as pn
import plotly.express as px
import pandas as pd

pn.extension('plotly', template="fast", sizing_mode='stretch_width')

data = pd.DataFrame([
    ('Monday', 7), ('Tuesday', 4), ('Wednesday', 9), ('Thursday', 4),
    ('Friday', 4), ('Saturday', 4), ('Sunay', 4)], columns=['Day', 'Orders']
)

fig = px.line(data, x="Day", y="Orders")
fig.update_traces(mode="lines+markers", marker=dict(size=10), line=dict(width=4))
fig.layout.autosize = True

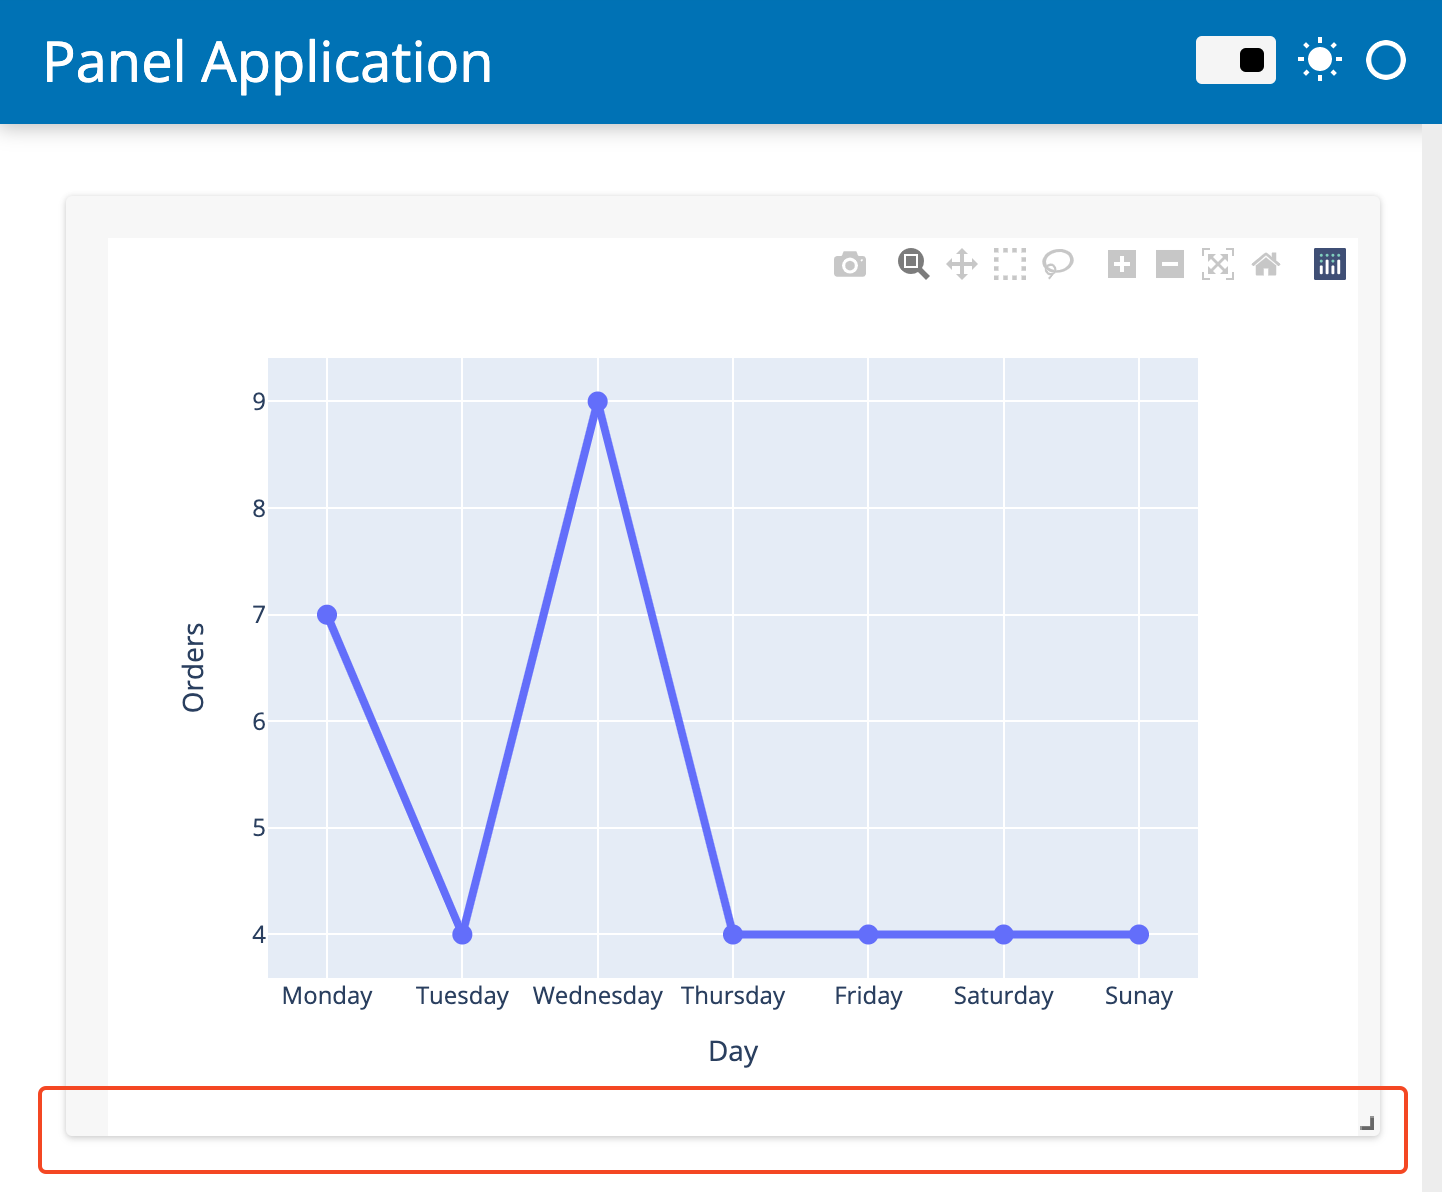
pn.pane.Plotly(fig, config={'responsive': True}, sizing_mode='stretch_both').servable()

This resulted (the plot was rendered properly in the card with margins):

  • Example 2: call .servable() on a template
import pandas as pd
import panel as pn
import plotly.express as px

pn.extension('plotly', sizing_mode='stretch_width')

data = pd.DataFrame([
    ('Monday', 7), ('Tuesday', 4), ('Wednesday', 9), ('Thursday', 4),
    ('Friday', 4), ('Saturday', 4), ('Sunay', 4)], columns=['Day', 'Orders']
)

fig = px.line(data, x="Day", y="Orders")
fig.update_traces(mode="lines+markers", marker=dict(size=10), line=dict(width=4))
fig.layout.autosize = True

responsive = pn.pane.Plotly(fig, config={'responsive': True})

template = pn.template.FastGridTemplate()
template.main[:3, :] = pn.panel(responsive, sizing_mode='stretch_both')

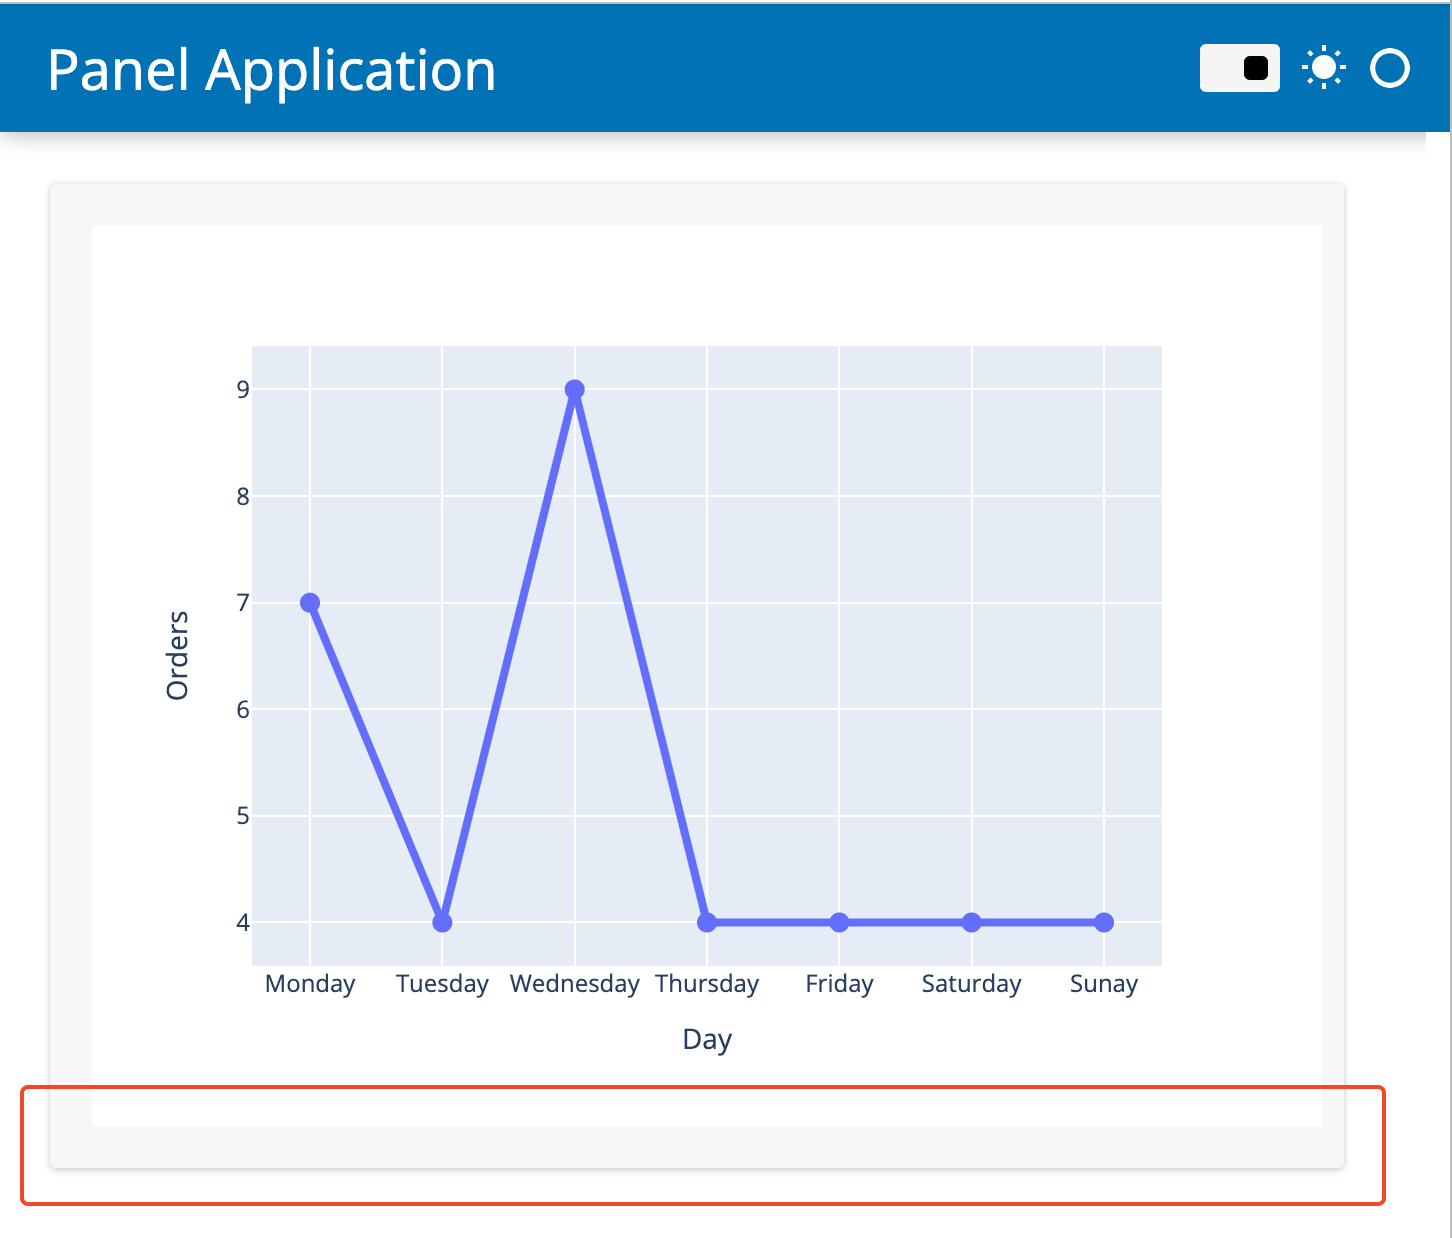
template.servable();

This resulted (The plot wasn’t rendered properly in the card, where the bottom margin was missing):

What is the difference between the two apis?

The api of Example 2 was there before the api of Example 1.

The api of Example 1 is an attempt to simplify the api - especially for quick, exploratory data apps and for notebook users. You might notice the fewer lines of code in Example 1. It enables you to write a minimum number of lines of code similarly to Streamlit.

What is the better practice?

For quick, exploratory data apps the api of Example 1 is superior because its so easy to use.

When your code grows and you want to

  • customize the look and feel more
  • write reusable and maintainable code

then the api of Example 2 makes a lot of sense to use.

Besides that the api of Example 1 provides access to the FastListTemplate. You will have to use the api of Example 2 to get access to the FastGridTemplate.

Why does the Plotly plot not resize correctly in Example 2.

I don’t now the underlying cause. But I can provide a workaround. You should wrap responsive in a pn.Column instead of pn.panel. Is this a bug @philippjfr?.

plotly-height-responsive

import pandas as pd
import panel as pn
import plotly.express as px

pn.extension('plotly', sizing_mode='stretch_width')

data = pd.DataFrame([
    ('Monday', 7), ('Tuesday', 4), ('Wednesday', 9), ('Thursday', 4),
    ('Friday', 4), ('Saturday', 4), ('Sunay', 4)], columns=['Day', 'Orders']
)

fig = px.line(data, x="Day", y="Orders")
fig.update_traces(mode="lines+markers", marker=dict(size=10), line=dict(width=4))
fig.layout.autosize = True

responsive = pn.pane.Plotly(fig, config={'responsive': True}, sizing_mode="stretch_both", )

template = pn.template.FastGridTemplate(save_layout=True, prevent_collision=True)
template.main[:3, :] = pn.Column(responsive, sizing_mode="stretch_both")

template.servable()
3 Likes

Thanks Marc! Good to know this, and learned a lot from your YouTube channel!

1 Like