Hi,
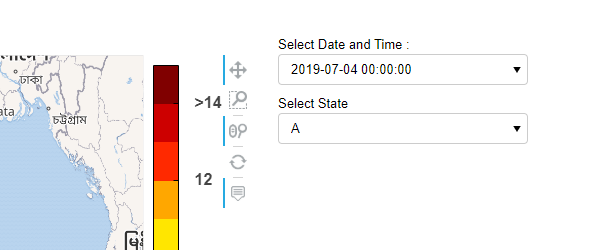
I have panel layout column plot which contain of Rows- Row[0] Holoviews (Div),Holoviews(Div),then Row[1] Holoviews(DynamicMap), column here i am using holomap concept also so i get drop down option, by selecting the option in my drop down the plot was changing when using bokeh server but now i want to write the callback function so that if the user change the drop down option as per the selected option in drop down plot appear.
Can you please guide me how to write the callback function of panel layout column easy way.
tiles = gv.tile_sources.Wikipedia
hmap1 = hv.HoloMap(allplot, kdims=['Select Date and Time :', 'Select State'])
dd = df_div.opts(width=70, height=70)
dd1 = df_div1.opts(width=600, height=90)
finalplot = pn.Column(pn.Row(dd, dd1),
tiles * rasterize(hmap1).options(**opts) * logo1.opts(hooks=[absolute_position],
apply_ranges=False))
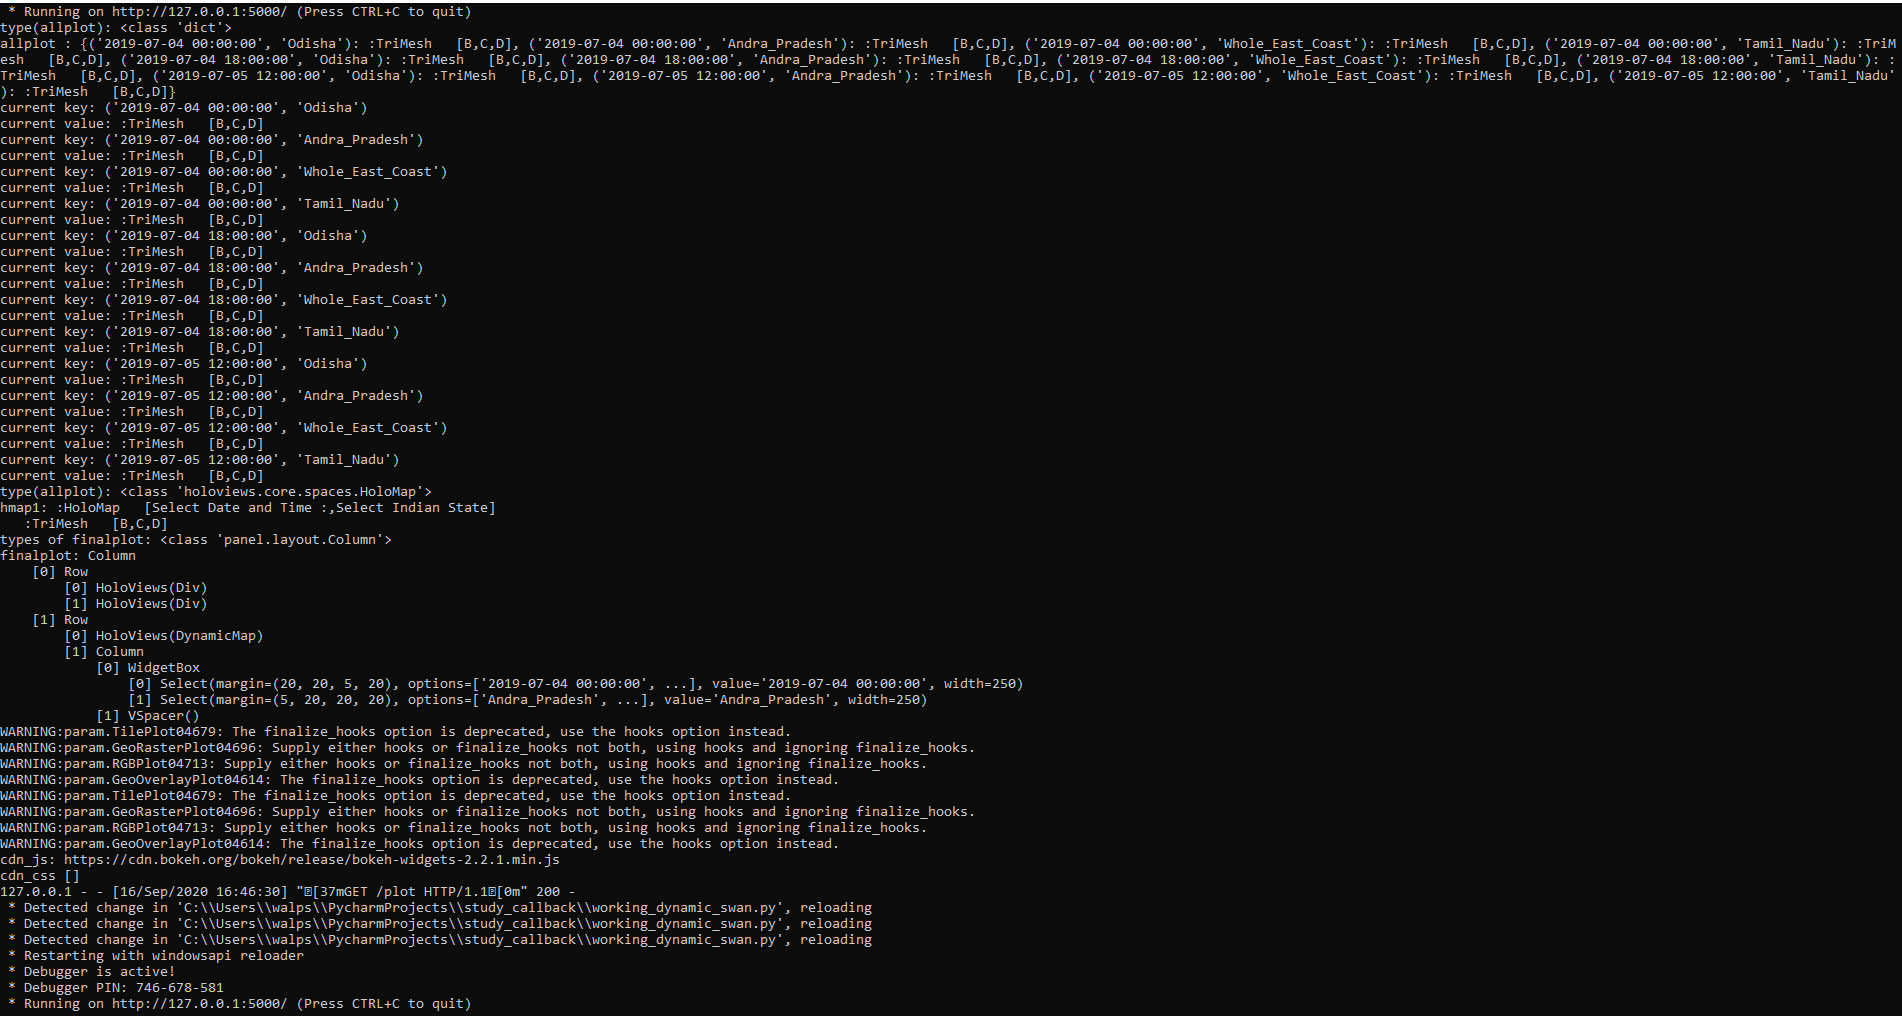
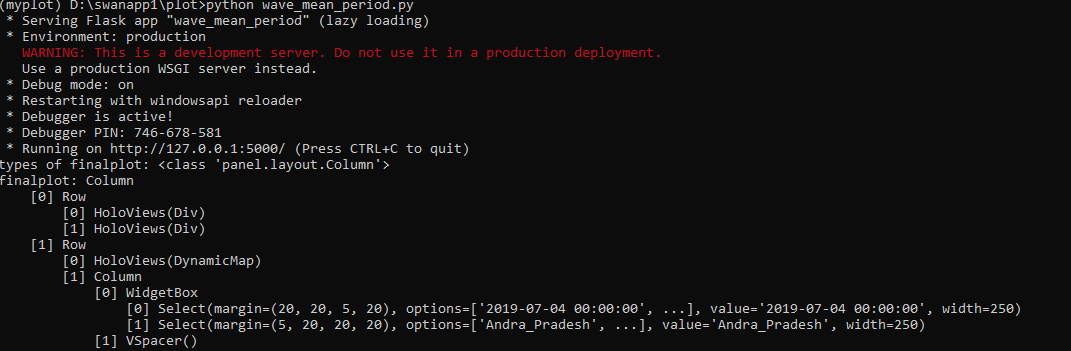
print("types of finalplot:",type(finalplot))
print("finalplot:",finalplot)
Output below
How i can write a callback function, so when user select someother state,as per selected state plot come,this was happening automatically when using bokeh server.
Thank you Very Much TIA.