Is it possible to use two backends within the same HoloViews application or do all the elements have to use the same backend?
I would like to use bokeh for some views but plotly (or some other backend) for others. Is there an easy way to do this?
Is it possible to use two backends within the same HoloViews application or do all the elements have to use the same backend?
I would like to use bokeh for some views but plotly (or some other backend) for others. Is there an easy way to do this?
Hoping to bump this issue and see if there is a way to do this. I’m working on a dashboard where most plots are generated with the bokeh backend but some other plots need to be generated with Plotly. I’m wondering if I can mix backends like this.
I’ve tried loading both extensions and passing the backend="..." option without much luck. Hoping to do something like
import holoviews as hv
hv.extension('bokeh', 'plotly')

# Plot with bokeh
hv.Points(df, kdims=['x', 'y'], vdims=['v']).opts(color=hv.dim('v'), backend='bokeh')

# Plot with plotly
hv.Points(df, kdims=['x', 'y'], vdims=['v']).opts(color=hv.dim('v'), backend='plotly')
But no matter what, both plots are the same backend and it seems the backend just controls where the opts are being captured for later static rendering which I think is outlined in the documentation here.
I’m curious if there is a way to have one plot with bokeh and one plot with plotly in the same dashboard
Maybe something like this
import holoviews as hv
import pandas as pd
import panel as pn
hv.extension('bokeh', 'matplotlib')
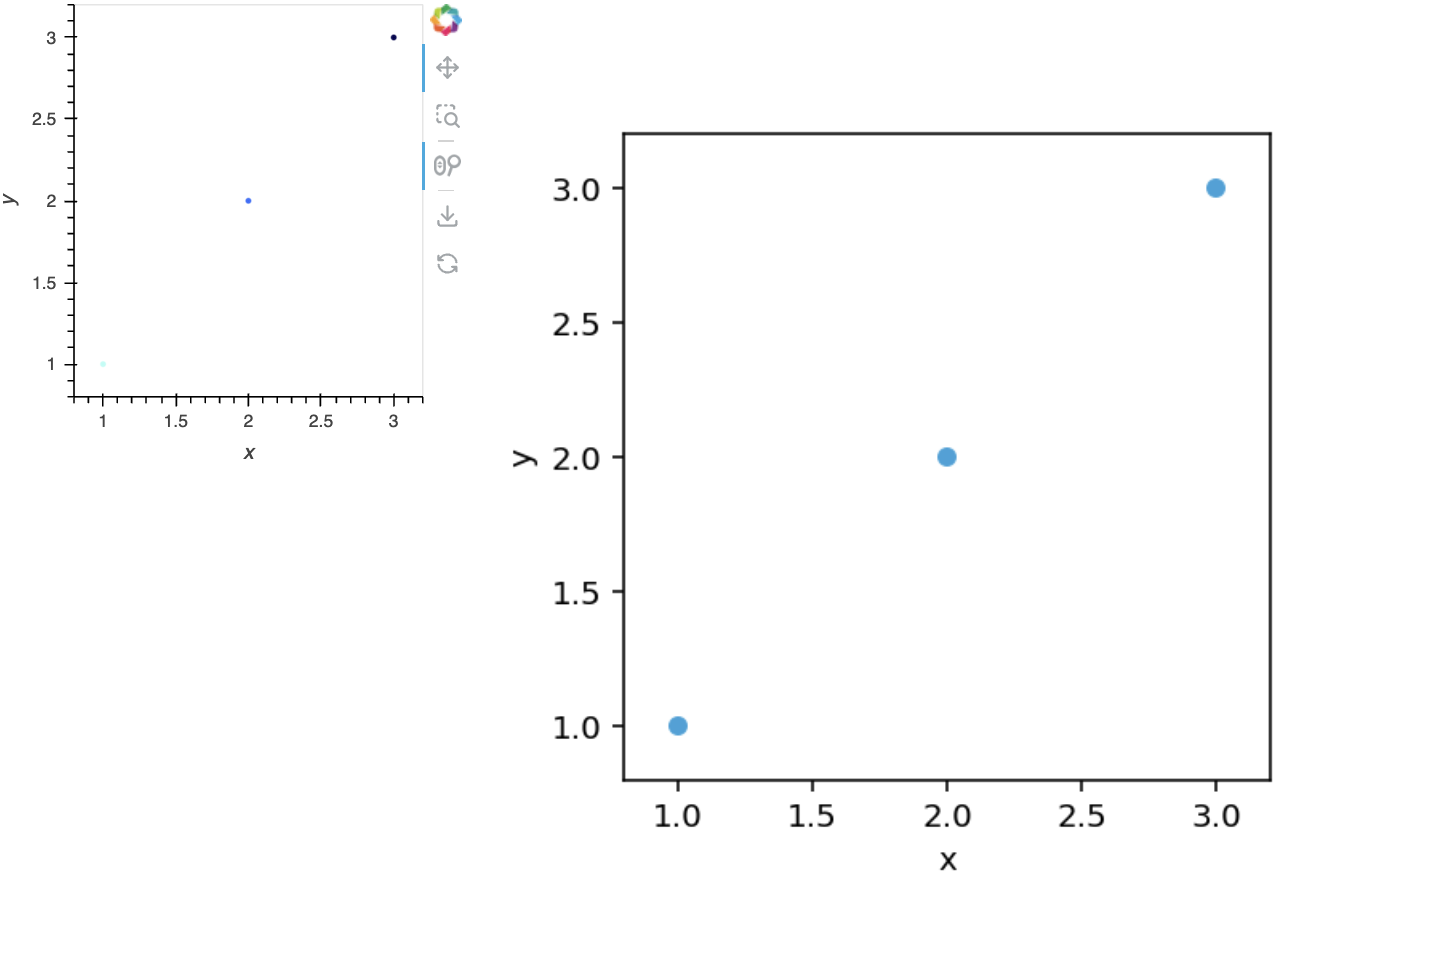
df = pd.DataFrame({'x': [1, 2, 3], 'y': [1, 2, 3], 'v': [1, 2, 3]})
# Plot with bokeh
pn.Row(
hv.render(hv.Points(df, kdims=['x', 'y'], vdims=['v']).opts(color=hv.dim('v')), backend='bokeh'),
hv.render(hv.Points(df, kdims=['x', 'y'], vdims=['v']).opts(color=hv.dim('v')), backend='matplotlib')
).show()
Thanks @ahuang11! That appears to do what I need!
The HoloViews pane also supports a backend parameter. The code below will produce the same.
import holoviews as hv
import pandas as pd
import panel as pn

pn.extension()
hv.extension("bokeh", "matplotlib")

df = pd.DataFrame({"x": [1, 2, 3], "y": [1, 2, 3], "v": [1, 2, 3]})

# Plot with bokeh
pn.Row(
    pn.pane.HoloViews(
        hv.Points(df, kdims=["x", "y"], vdims=["v"]).opts(color=hv.dim("v")),
        backend="bokeh",
    ),
    pn.pane.HoloViews(
        hv.Points(df, kdims=["x", "y"], vdims=["v"]).opts(color=hv.dim("v")),
        backend="matplotlib",
    ),
).servable()