Hi,
It’s really great that hvplot has a candlestick chart (called ohlc).
But is there a way to get rid of the non-trading periods in the hvplot candlestick charts? I tried converting the index to strings (error) or to categories (looks weird). The only thing that seems to work is a purely numerical index. @Marc, maybe are interested in this issue?
The standard in finance is that those gaps are removed (don’t ask me why, but it’s true). Every single software / platform / (scientific) publication does it like that.
import pandas as pd
import numpy as np
import hvplot.pandas
days = 50
open = np.random.randn(days).cumsum() # sorry, overwriting built-in function for clarity
close = np.append(open[1:], open[-1]+np.random.random_sample())
high = np.maximum(open,close) + np.random.lognormal(sigma=0.5, size=days)/3
low = np.minimum(open,close) - np.random.lognormal(sigma=0.5, size=days)/3
df = pd.DataFrame([open,high,low,close], index=['open','high','low','close']).T
df.index = pd.period_range(start='2022-01-01', periods=days, freq='B').to_timestamp()
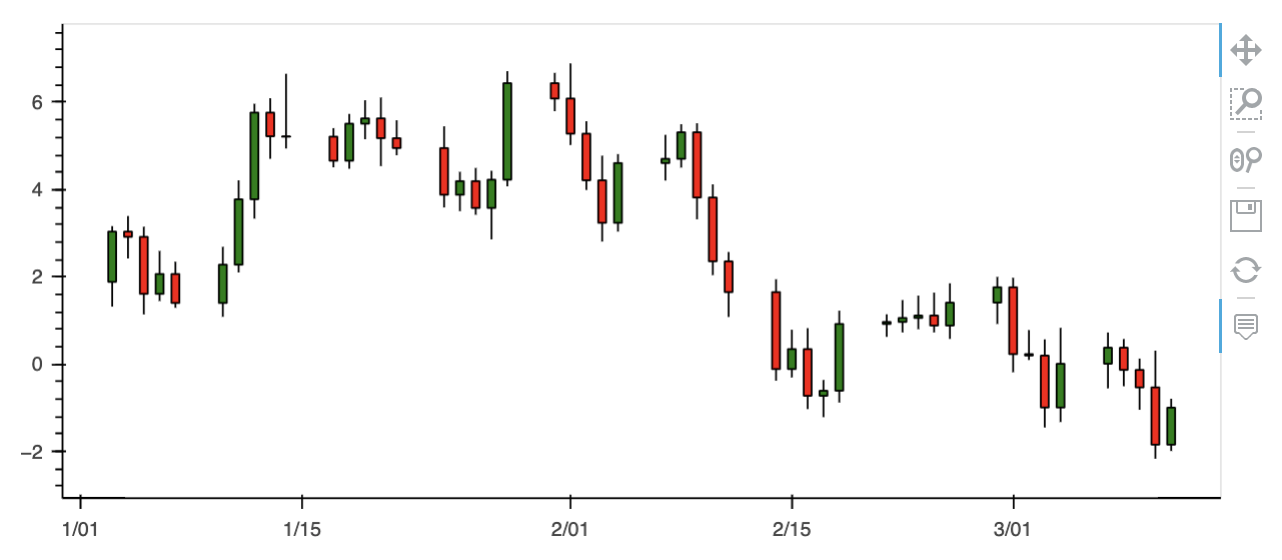
df.hvplot.ohlc()
hvplot
Standard trading platform
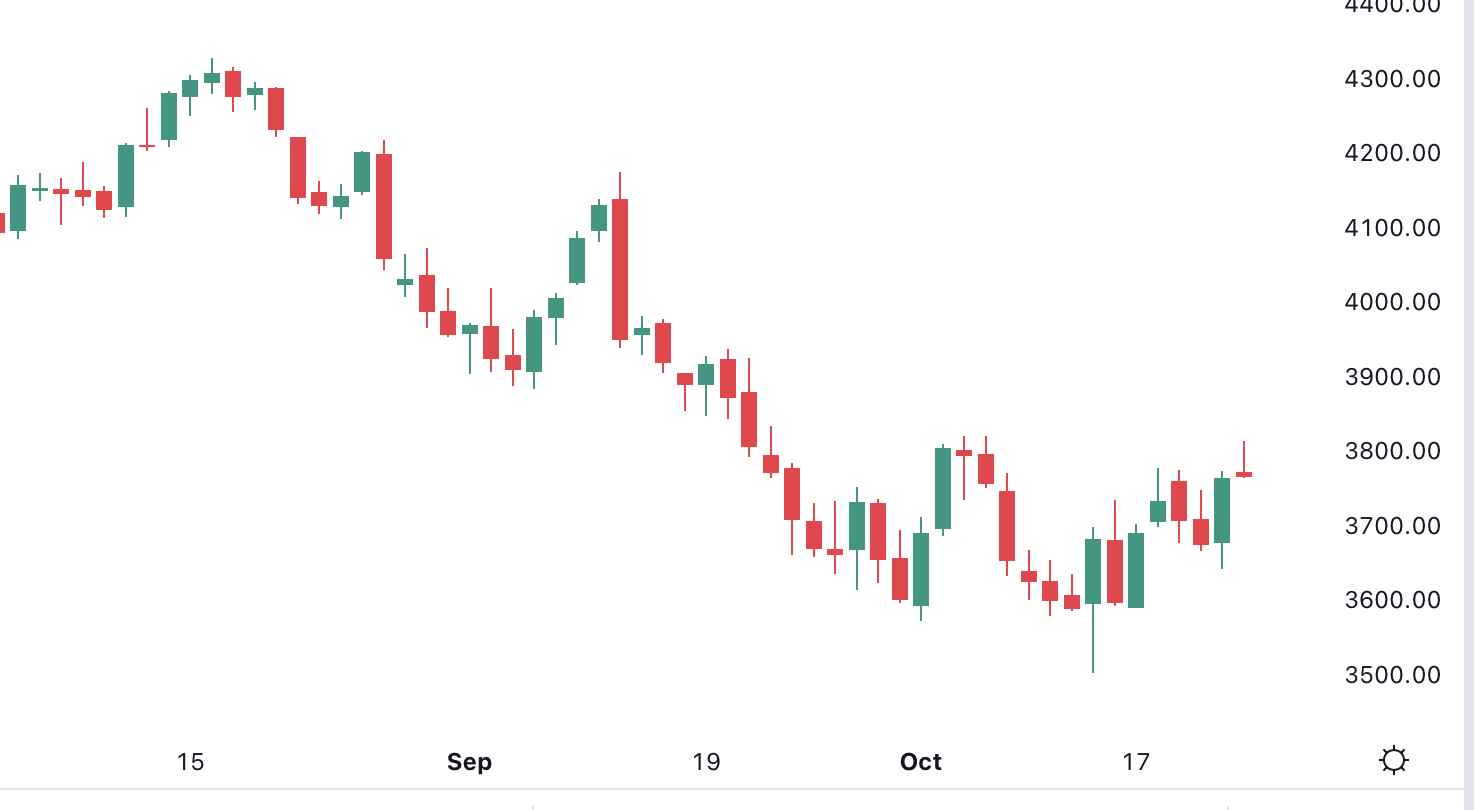
Just as a note how this is done in finance: On daily charts, weekends and market holidays are removed, on intraday charts, periods with no trading activity are removed, even when the market was open.
Sometimes charting software has a setting to show intraday periods where the market was open, but no trading happened. But for that the software has to know the trading hours for each instrument, which can be complex due to different holiday schedules (never mind timezones).
Also: the current chart type is called ohlc, but ohlc charts are actually something else (also called bar charts). they should be called candlestick.
Another thing I was looking for is to make the outline of the candlestick box invisible. Currently, if I set line_width=0, then also the tails/wicks disappear.
In addition, the parameter bar_width is pretty hidden. It is not described for example in hvplot.help('ohlc').