t=np.arange(0,10, 1)
f=[0.1*2**n for n in np.arange(0,10,1)]
mt,mf=np.meshgrid(t, f)
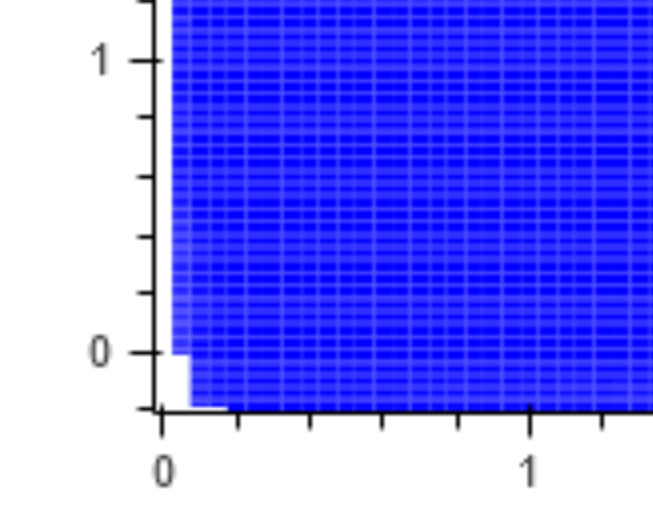
hv.QuadMesh((t,f,0*mt)).opts(show_grid=False, cmap='gray', width=400)
show_grid has no effect, neither does the option grid_style.
Any workaround?
t=np.arange(0,10, 1)
f=[0.1*2**n for n in np.arange(0,10,1)]
mt,mf=np.meshgrid(t, f)
hv.QuadMesh((t,f,0*mt)).opts(show_grid=False, cmap='gray', width=400)
show_grid has no effect, neither does the option grid_style.
Any workaround?
Not so much the grid, but the edges of the cells. I remember there being an option in heatmap, but I can’t find it
I have same issue – see image - white lines appear, impossible to get rid of. When the heatmap involves subtle colour changes, this can completely ruin it. any ideas how can get rid of these?
Thanks for any help.
Maybe the dilate option from bokeh through hooks
Actually it might be directly supported in hv through opts
http://holoviews.org/_modules/holoviews/plotting/bokeh/heatmap.html
Or it might be xmarks or ymarks
Thanks,
dilate looks promising, however i tried a hook with
plot.handles[‘glyph’].dilate = True
but got error
WARNING:param.QuadMeshPlot45955: Plotting hook <function gridded_data.draw_bokeh..hook at 0x00000280872544C8> could not be applied:
unexpected attribute ‘dilate’ to Quad, possible attributes are bottom, fill_alpha, …
Oh you’re using Quadmesh not HeatMap, I think submit a GitHub issue in bokeh about it. There doesn’t seem to be dilate in there: bokeh.models.glyphs.Quad — Bokeh 2.3.3 Documentation unlike rect bokeh.models.glyphs.Rect — Bokeh 2.3.3 Documentation
You can also try changing
line_color
If you have not already done it, also checkout hv.help(hv.QuadMesh) to see all the parameters and options.
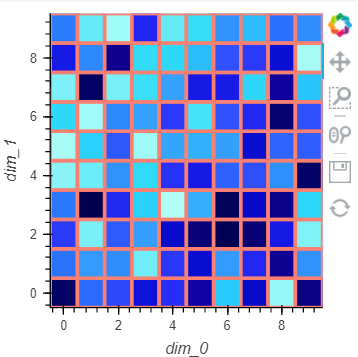
I tried experimenting. And I believe the lines are not a “grid” but in fact “lines” and that is what you should search for. I can see you can in fact control the lines (except remove them fully :-))
import numpy as np
import holoviews as hv
import xarray as xr

hv.extension("bokeh")

hv.QuadMesh(xr.DataArray(np.random.rand(10, 10))).opts(
    line_color="salmon",
    line_width=3,
    line_alpha=1,
)
I also tried looking at the source code for class QuadMesh at GitHub web editor but it did not help me either. Neither did the source code of the bokeh backend implementation holoviews.plotting.bokeh.raster — HoloViews 1.14.5 documentation. But you might be able to identify something there. My understanding is that the bokeh glyph drawn is a quad. The source code of that might also help find a solution?? bokeh.models.glyphs.Quad — Bokeh 2.3.3 Documentation
That solves it! It suffices to set line_alpha = 0
Thank you @Marc
I got a little bit excited about the QuadMesh and promoted it on Twitter.
Feel free to share if you like https://twitter.com/MarcSkovMadsen/status/1426779710583975940?s=20
import numpy as np
import holoviews as hv
import xarray as xr
import panel as pn

pn.extension("ace", sizing_mode="stretch_width")
hv.extension("bokeh")

color = "#00A170"
data = xr.DataArray(np.random.rand(10, 10))


def quad_mesh(line_color="salmon", line_width=1, line_alpha=1):
    return (
        hv.QuadMesh(data)
        .opts(
            line_color=line_color,
            line_width=line_width,
            line_alpha=line_alpha,
        )
        .redim(dim_0="x", dim_1="y")
        .opts(responsive=True)
    )


def code(line_color="salmon", line_width=1, line_alpha=1):
    return pn.widgets.Ace(
        value=f"""\
hv.QuadMesh(data).opts(
    line_color="{line_color}",
    line_width={line_width},
    line_alpha={line_alpha},
)""",
        height=100,
    )


color_picker = pn.widgets.ColorPicker(name="line_color", value=color)
width_slider = pn.widgets.IntSlider(name="line_width", value=3, start=0, end=10)
alpha_slider = pn.widgets.FloatSlider(name="line_alpha", value=1, start=0.0, end=1.0, step=0.1)

quad_mesh = pn.bind(
    quad_mesh, line_color=color_picker, line_width=width_slider, line_alpha=alpha_slider
)
code = pn.bind(code, line_color=color_picker, line_width=width_slider, line_alpha=alpha_slider)

component = pn.panel(hv.DynamicMap(quad_mesh), min_height=300, sizing_mode="stretch_both")

panel_logo = pn.pane.PNG(
    "https://panel.holoviz.org/_static/logo_stacked.png",
    link_url="https://panel.holoviz.org",
    embed=False,
    sizing_mode="fixed",
    align="center",
    height=100,
)

description = """## HoloViews QuadMesh

Helping HoloViews users on Discourse remove the lines of a QuadMesh.

The lines can be removed by setting `line_alpha=0`"""

pn.template.FastListTemplate(
    site="Awesome Panel",
    title="HoloViews QuadMesh",
    header_accent_base_color=color,
    header_background=color,
    header_color="white",
    accent_base_color=color,
    sidebar_width=300,
    main_max_width="95%",
    sidebar=["## ⚙️ Settings", alpha_slider, width_slider, color_picker, "## 📄 Code", code],
    main=[pn.Row(description, panel_logo), component],
).servable()
Just for fun I tried changing to hv.extension("plotly") and hv.extension("matplotlib"). But they don’t have any lines.