Hi!, I’m trying to create parameterized classes that filter rows from a DataFrame and will update the filtering in a cascading way. If there are two filters and the first one changes, then the second one will update as well and will now use the data remaining after the first filter as the starting point for its own filtering.
I have the following code right now, but the connection between the ix_before and ix_after parameters of two instances of FilterIrradiance created when calling Filters.add_filter is broken as soon as the first filter is updated.
Is there a way to make this work or should I look at other approaches to solve this?
Thanks!
# create synthetic data
x = np.arange(0, 1200, 10)
y = x
y2 = x + 50
df = pd.DataFrame({'poa':x, 'power':y})

class FilterIrradiance(param.Parameterized):
    irr_range = param.Range(default=(0,1200), bounds=(0, 1200))
    ix_before = param.Array(precedence=-1)
    ix_after = param.Array(precedence=-1)
    ix_dropped = param.Array(precedence=-1)

    def __init__(self, df, column_name, **param):
        super().__init__(**param)
        self.df = df
        self.column_name = column_name

    @param.depends('ix_before', 'irr_range', watch=True)
    def __call__(self):
        if self.ix_before is None:
            starting_df = self.df
        else:
            starting_df = self.df.loc[self.ix_before, :]
        ix = starting_df[(starting_df[self.column_name] >= self.irr_range[0]) & (starting_df[self.column_name] <= self.irr_range[1])].index
        self.ix_after = ix.to_numpy()
        self.ix_dropped = self.df.index.difference(ix).to_numpy()

    @param.depends('ix_before', 'irr_range')
    def plot(self):
        self.__call__()
        return df.loc[self.ix_after, :].hvplot(kind='scatter', x='poa', y='power').opts(xlim=(0, 1250))

class Filters(param.Parameterized):
    filters = param.List()

    def add_filter(self, new_filter):
        if len(self.filters) == 0:
            self.filters.append(new_filter)
        else:
            last_filter = self.filters[-1]
            self.filters.append(new_filter)
            last_filter()
            self.filters[-1].ix_before = last_filter.ix_after

def olay(filters):
    widgets = pn.Column(*[a.param for a in filters.filters])
    overlay = hv.Overlay([hv.DynamicMap(flt.plot) for flt in filters.filters]).collate()
    return pn.Row(widgets, overlay)
filters = Filters()
filters.add_filter(FilterIrradiance(df, 'poa', irr_range=(40, 800)))
filters.add_filter(FilterIrradiance(df, 'poa', irr_range=(100, 500)))
olay(filters)
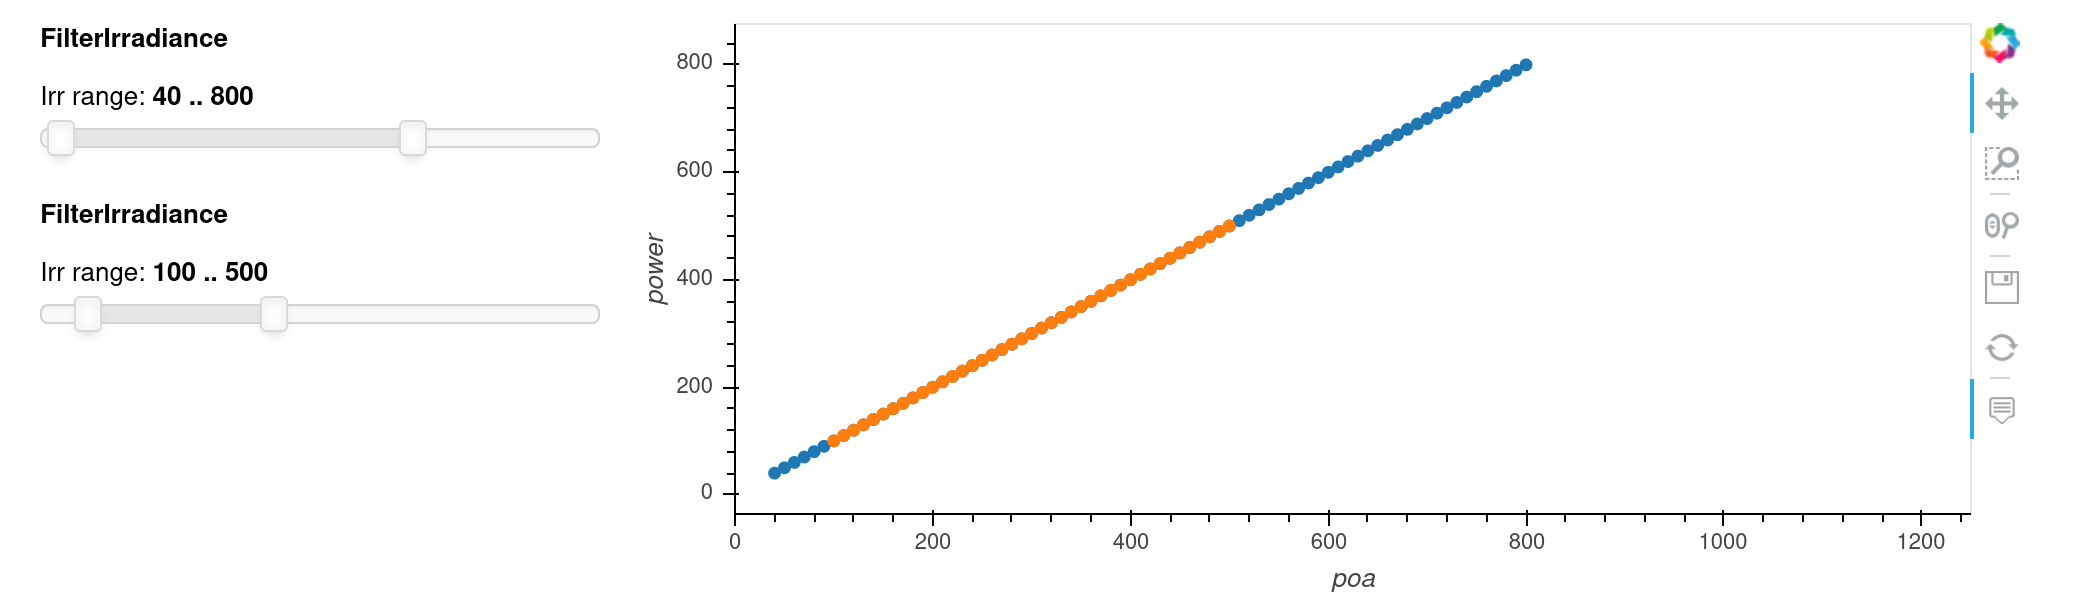
In this example, I’d like for the orange trend, which is the second filter to reflect changes in the first filter, so if you changed the minimum value of the first filter to 200 the orange plot would react to show that.
