# Area example 2
import holoviews as hv
hv.extension('bokeh')
import panel as pn
pn.extension()
from holoviews import dim, opts
import numpy as np
np.random.seed(42)
xs = np.linspace(0, np.pi*2, 20) # x value
ys_up = np.sin(xs)+np.random.rand(len(xs))
ys_bo = ys_up - 1
ys_line = np.sin(xs)+np.random.rand(len(xs))
ys_color = [1 if ys_line[x]>ys_up[x] or ys_line[x]<ys_bo[x] else 0 for x in range(len(xs))]
path_data = [(xs[x],ys_line[x],ys_color[x]) for x in range(len(xs))]
levels = [0, 0.5, 1]
colors = ['green', 'red']
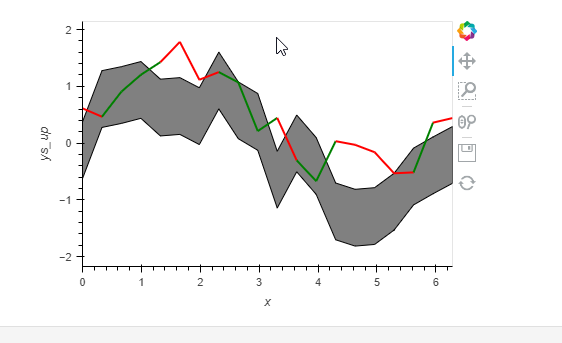
Area_Plot = hv.Area((xs, ys_up, ys_bo),vdims =['ys_up', 'ys_bo']).opts(color = 'gray')
Path_Plot = hv.Path([path_data], vdims='Wind Speed').opts(
color='Wind Speed', color_levels=levels, cmap=colors, line_width=2, width=450)
Area_Plot*Path_Plot
But this does not achieve my need, cause the color is change after a actual point not after out of the area chart.
Do we have a batter idea to make this kind of chart?
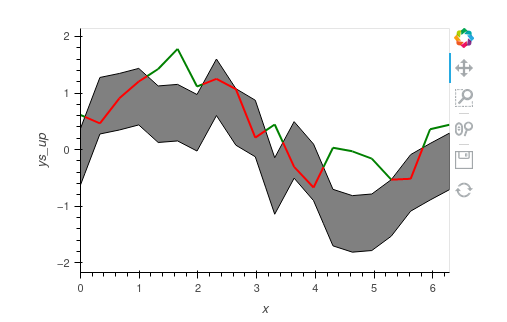
I don’t think there is a good way to do it other than the hard way of finding the intersection. (Maybe in geoviews). I have used shapely but another tool like scipy can also be used.
import holoviews as hv
import numpy as np
import panel as pn
from holoviews import dim, opts
from shapely.geometry import LineString

hv.extension("bokeh")
pn.extension()

np.random.seed(42)
xs = np.linspace(0, np.pi * 2, 20)  # x value
ys_up = np.sin(xs) + np.random.rand(len(xs))
ys_bo = ys_up - 1
ys_line = np.sin(xs) + np.random.rand(len(xs))

# Find intersections
# Ref: https://stackoverflow.com/questions/28766692/intersection-of-two-graphs-in-python-find-the-x-value
l1 = LineString(np.column_stack([xs, ys_line]))
l2 = LineString(np.column_stack([xs, ys_up]))
l3 = LineString(np.column_stack([xs, ys_bo]))

i1 = l1.intersection(l2)
i2 = l1.intersection(l3)

x1 = [p.coords.xy[0][0] for p in i1.geoms] if not i1.is_empty else []
x2 = [p.coords.xy[0][0] for p in i2.geoms] if not i2.is_empty else []

xsi = np.concatenate([xs, x1 + x2])
xsi.sort()

# Interpolating and finding overlap
ysi_line = np.interp(xsi, xs, ys_line)
ysi_up = np.interp(xsi, xs, ys_up)
ysi_bo = np.interp(xsi, xs, ys_bo)

olap1 = ysi_bo[:-1] + ysi_bo[1:] <= ysi_line[:-1] + ysi_line[1:]
olap2 = ysi_line[:-1] + ysi_line[1:] <= ysi_up[:-1] + ysi_up[1:]
olap = np.concatenate([olap1 & olap2, [False]])

# Creating plot
area = hv.Area((xsi, ysi_up, ysi_bo), vdims=["ys_up", "ys_bo"]).opts(color="gray")
path = hv.Path((xsi, ysi_line, olap), vdims="Wind Speed").opts(
    color="Wind Speed", cmap=["green", "red"], line_width=2, width=450
)
area * path