I want to change the format of the nested xaxis ticks labels for boxplot chart (major, group and subgroup in terms of bokeh.models.CategoricalAxis attributes).
The following code is based on Boxplot Chart — HoloViews v1.18.1
import holoviews as hv
from holoviews import dim
hv.extension('bokeh')
from bokeh.sampledata.autompg import autompg as df
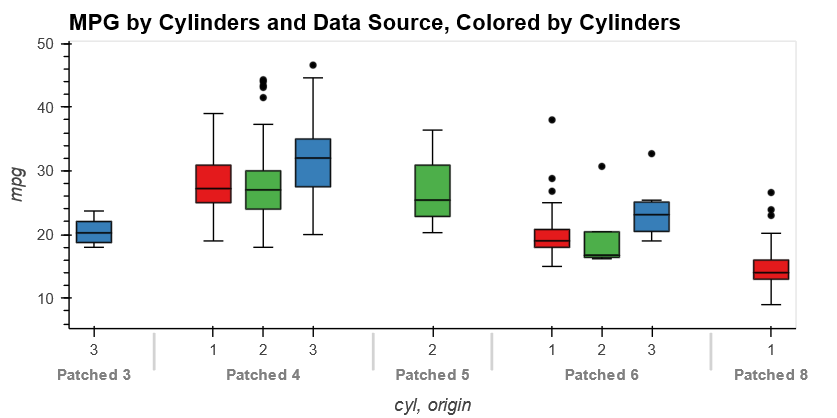
title = "MPG by Cylinders and Data Source, Colored by Cylinders"
boxwhisker = hv.BoxWhisker(df, ['cyl', 'origin'], 'mpg', label=title)
boxwhisker.opts(show_legend=False, width=600, box_fill_color=dim('origin').str(), cmap='Set1')
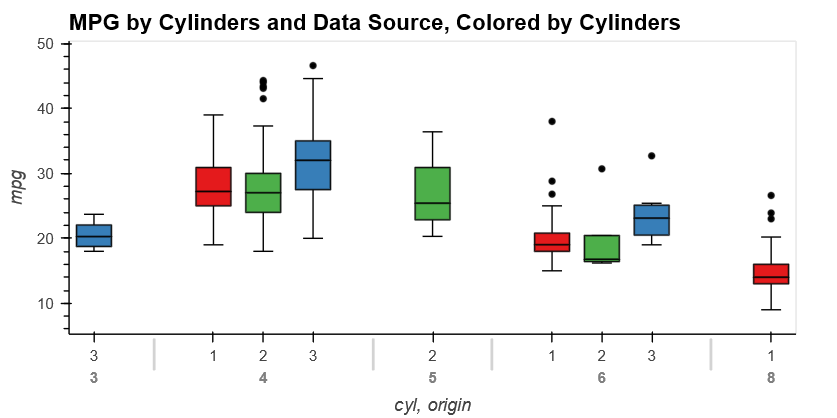
I want to change the format of the nested group-axis ticks labels (cyl-level).
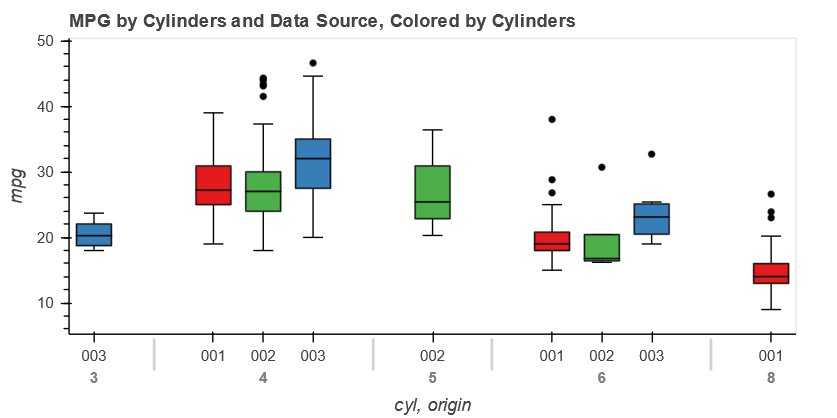
If I change figure.xaxis.formatter the major axis (origin-level) format is changed:
from bokeh.plotting import show
from bokeh.models import NumeralTickFormatter
figure = hv.render(boxwhisker)
figure.xaxis.formatter = NumeralTickFormatter(format="000")
show(figure)
But I can’t find the attributes (or any other way) to change group-axis ticks labels format (cyl-level). Smth like figure.x axis.major_label_orientation for major-axis ticks label orientation and figure.x axis.group_label_orientation for group-axis ticks label orientation.
Maybe this problem requires a very specific (custom) solution, for example pass x_range parameter while initializing bokeh.plotting.figure(x_range=bokeh.models.FactorRange(...)) (seen on Bar charts — Bokeh 3.3.2 Documentation ).
Also I read that categorical ranges is sequences of strings (here). So I have to convert my dataframe columns for xaxis as strings in the format I need.
Thanks in advance for any advice.