I am working on a telecommunication project for which I want to create a HexTiles map. I managed to change the size of each HexTile according to the count of values that fall inside the HexTile. However, for this project, I want to change the size according to a column value in the dataset.
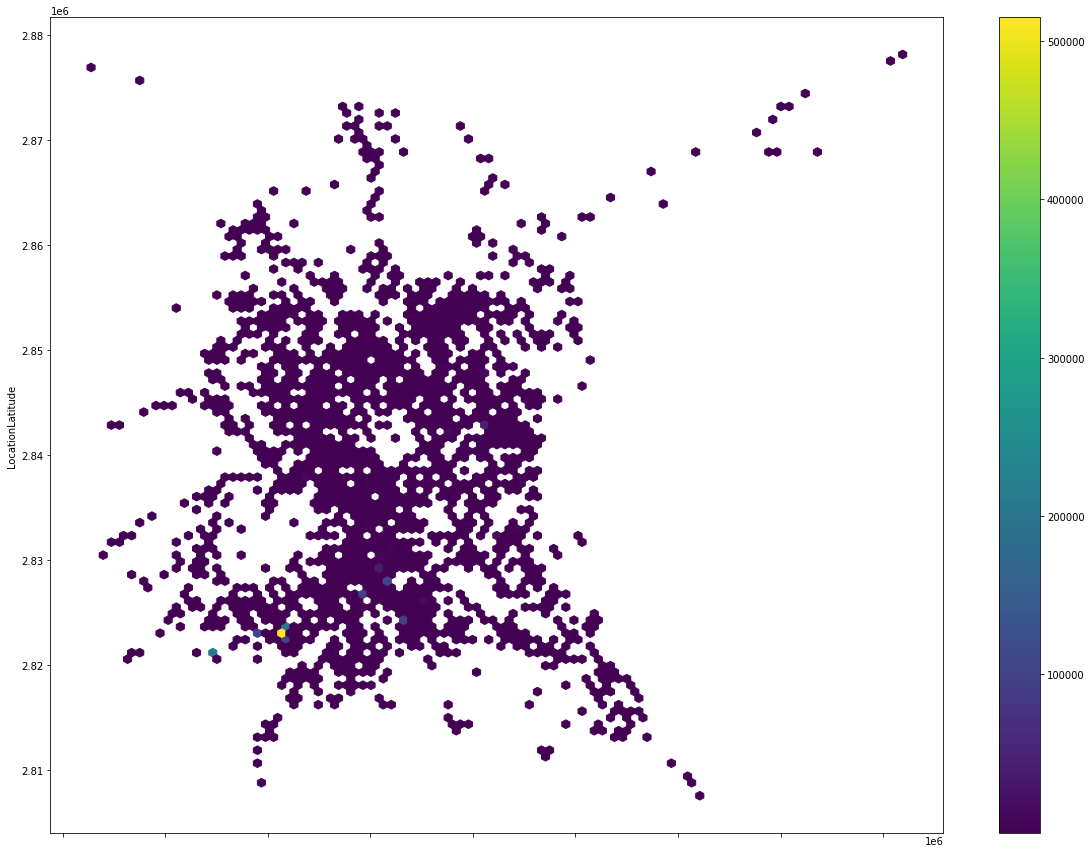
I was able to achieve this on ‘matplotlib’ using the ‘hexbin’ function like this:
It should be possible. You can use pn.bind and a pn.widgets.Select. If you want a more concrete answer, I need to see a minimal, reproducible example (MRE)?
In general, a complete script that can be copied/pasted and immediately run, as-is, with no modifications. This is much more useful than snippets.
Thanks for your reply @Hoxbro.
I tried using a widget and bind, and it works, only with Holoviews maps, but the issue is that the size of the tile isn’t in accordance with the ‘TrafficVolume’ but rather with the number of data points inside the ‘HexTile’.
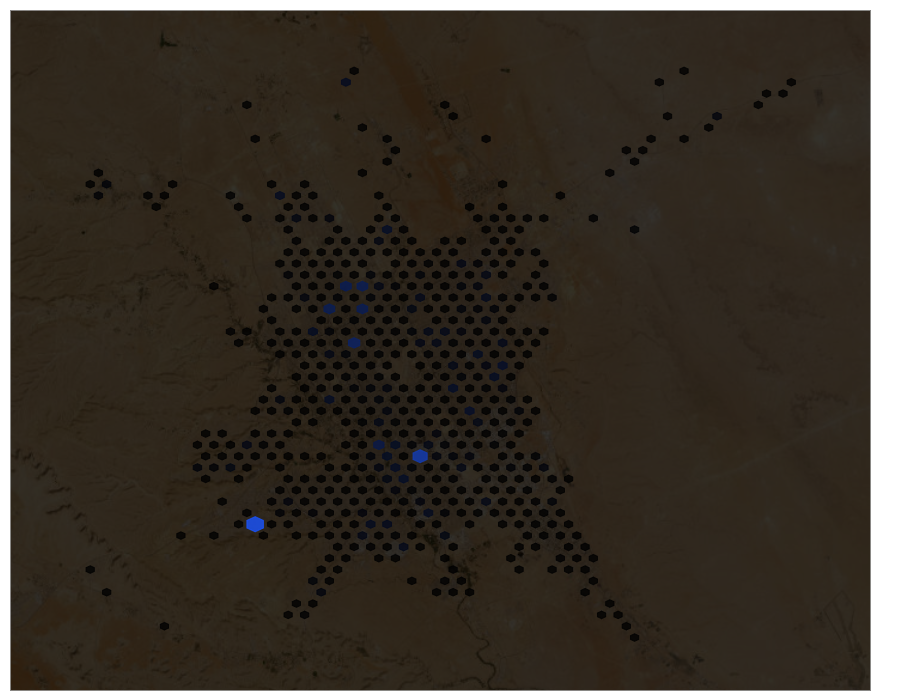
My issue isn’t with binding the map with the widgets, but with controlling the size of the HexTiles. The map produced using Holoviews is different from the one produced by Matplotlib. This is the one produced by Holoviews:
I managed to solve the issue using the following code:
COLORS = {"Operator A": cc.kr, "Operator B": cc.kg, "Operator C": cc.kb}
AGGS = {"Average": np.mean, "Minimum": np.min, "Maximum": np.max, "90th Percentile":pd.DataFrame.quantile}
PLOT_WIDTH = 900
PLOT_HEIGHT= 700
def traffic_plot(operator_name):
    """Plots a hexbin for each operator where the size of each hex depends on the counts of values that falls inside this hex"""
    df_operator = df[df["RadioOperatorName"] == operator_name]
    if (len(df_operator) == 0 ):
        return esri
    operator_tiles =  hv.element.HexTiles(df_operator, kdims=["LocationLongitude", "LocationLatitude"], vdims=["TrafficVolume"])
    operator_tiles.opts(cmap=COLORS[operator_name], alpha=0.8, cnorm="linear", tools=["hover"], width=PLOT_WIDTH, height=PLOT_HEIGHT, scale=(hv.dim('TrafficVolume').norm()*0.5)+0.5)
    return (esri * operator_tiles).opts(hv.opts.HexTiles(aggregator=np.sum))
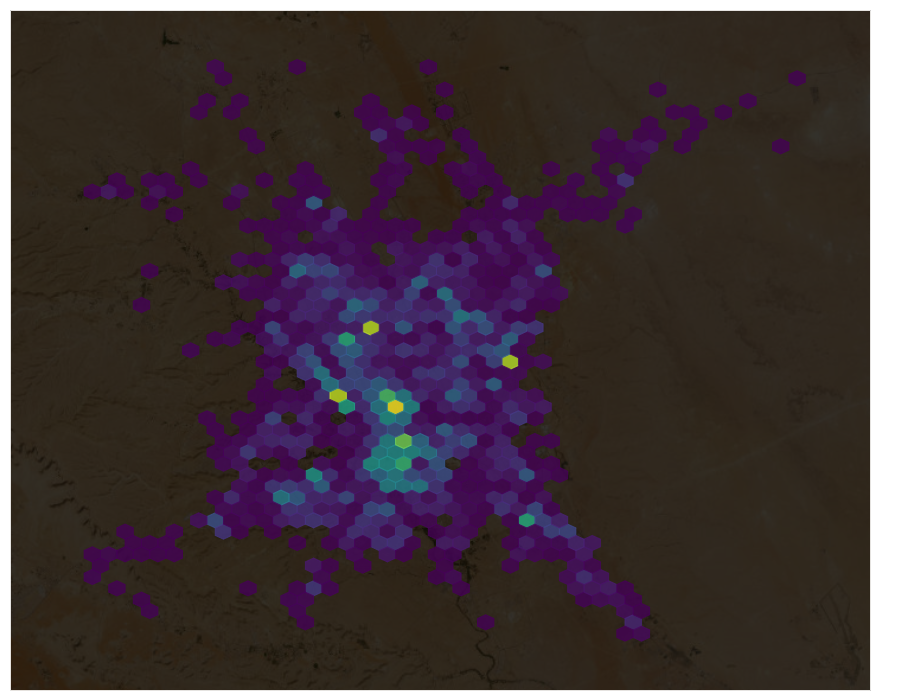
The trick is to add the column as a ‘vdim’ and then set the aggregator to the sum. The biggest tile will also have the highest value in the colormap, as you see below: