Clabel doesn't update in hvplot.scatter

Hello!

I have an interactive plot driven through panel and using df.hvplot.scatter(...). When I make an update in the widgets that control axes, the data (x,y, and c) all update fine and the xlabel and ylabel udpate as well, but but the clabel (on the colorbar) stays at the initial value. You can see this on the attached gif.

Here’s the code:

def plot_pareto(pareto_sum, x,y,z, thresh, generations):
    if thresh is not None:
        pareto_sum = pareto_sum.loc[(pareto_sum.total_ng_commit_pumping>=thresh[0]) &
                               (pareto_sum.total_ng_commit_pumping<=thresh[1])]
    if generations is not None:
        pareto_sum = pareto_sum.loc[(pareto_sum.index>=generations[0]) & 
                                   (pareto_sum.index<=generations[1])]
    
    pplot = pareto_sum.hvplot.scatter(x=objectives_r[x],
                    y=objectives_r[y],
                    c=objectives_r[z],
                                      legend=False,
                     hover_cols=list(objectives.keys()))
    hover_run = HoverTool(
        tooltips = list(zip(
                        [f'{k}:' for k in objectives_r.keys()],
                        [f'@{v}{{%3.2f}}%' for v in objectives_r.values()])),
        formatters = {f'@{v}': 'printf' for v in objectives_r.values()}
        )
    pplot.opts(
        xlabel=x,
        ylabel=y,
        clabel=z,
        size=10, 
        height=300,
        width=650,
        title=z,
        tools=['tap', hover_run],
        active_tools=['pan','tap','wheel_zoom'],
        cmap='magma'

    )
    return pplot
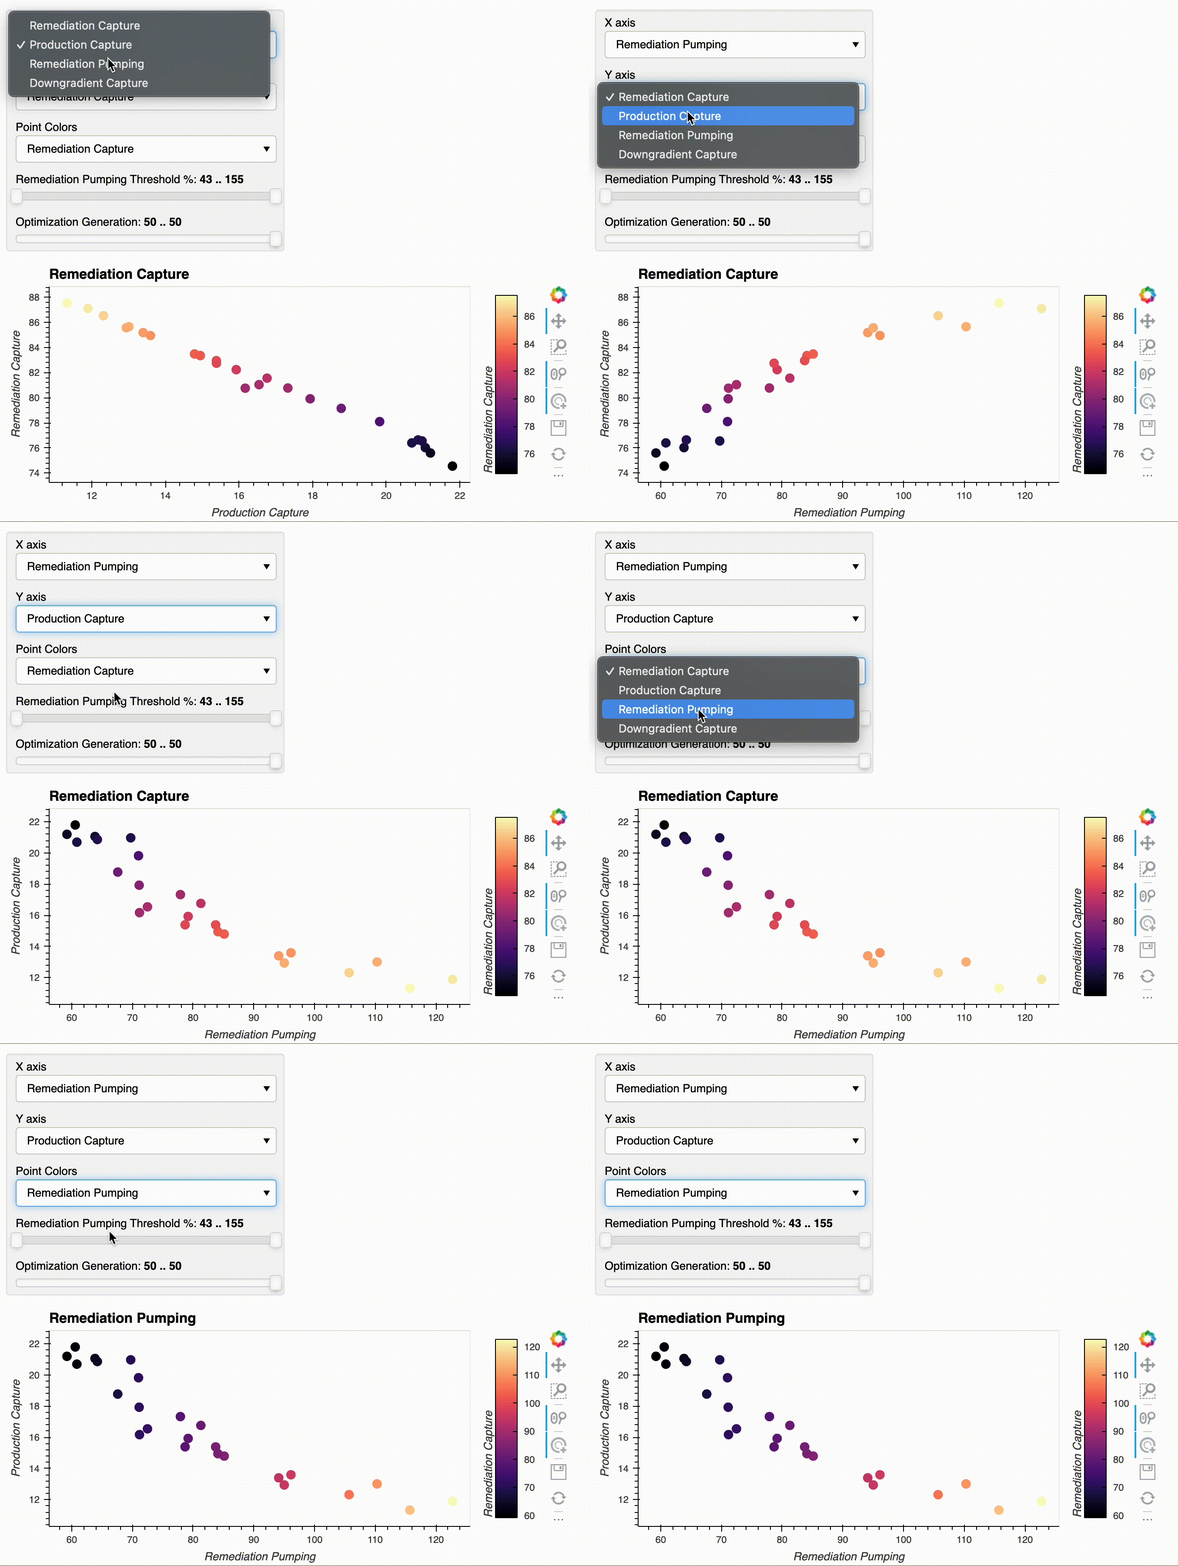
oops - problem uploading the gif. Hopefully this works…
screenshot

Hi @mnfienen

Can you share a minimal, reproducible example (MRE)?

In general, a complete script that can be copied/pasted and immediately run, as-is, with no modifications. This is much more useful than snippets.

Good call - sorry about that @Hoxbro. The data are not public, but didn’t think of making a quick fake dataset. In this MRE the behavior is reproduced…e.g. selecting on the Point Colors dropdown changes color scale but doesn’t update clabel whereas selecting x and y axis changes the data AND the xlabel/ylabel.

Thanks!

import pandas as pd
import numpy as np
import panel as pn
import hvplot.pandas # noqa: API import
pn.extension()
# cook up some fake data
df = pd.DataFrame(columns=['x','y','z','c'], 
        data=np.random.random((120,4)))
df.c *=100
# make the selector widgets
xaxis_dropdown = pn.widgets.Select(
    name='X axis', value='x', options=['x','y','z','c'])
yaxis_dropdown = pn.widgets.Select(
    name='Y axis', value='y',options=['x','y','z','c'])
zaxis_dropdown = pn.widgets.Select(
    name='Point Colors', value='z',options=['x','y','z','c'])
# plotting function
def plot_pareto(df, x,y,z):   
    pplot = df.hvplot.scatter(x=x, y=y,c=z,
        legend=False, hover_cols=['x','y','z','c'])
    pplot.opts(
        xlabel=x,ylabel=y,clabel=z,
        size=10,height=300,width=650,
        tools=['tap', 'hover'],active_tools=['pan','tap','wheel_zoom'])
    return pplot
# make the panel
pp = hv.DynamicMap(pn.bind(plot_pareto,
    df=df.copy(),x=xaxis_dropdown, y=yaxis_dropdown, z=zaxis_dropdown))
pwidget = pn.WidgetBox(xaxis_dropdown, yaxis_dropdown, zaxis_dropdown)           
pane1 = pn.Column(pwidget, pp)
pane1.show()
1 Like