I am trying to recreate the following type of plot using Holoviews or Hvplot. I found this Github issue that Mr. @philippjfr and Mr. @jbednar commented on. I tried to follow the Github Thread but even today in the Holoviews documentation it is not shown and in the API reference it does not mention clabel. Is there an interactive way to do it or must it be a matplotlib backend application to have the clabels working.
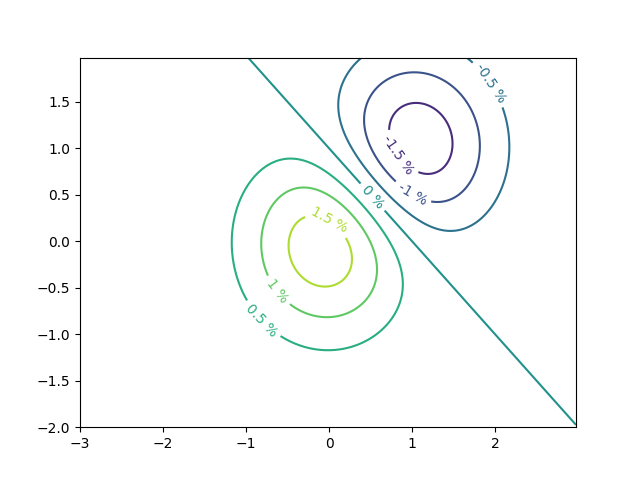
I found the ugliest contour plot I could find at my institute and added it here for context of what I am trying to replace with beatiful interactive Bokeh goodness.
