I have made an app that I have working but I need some Panel 1.x expertise to refactor and understand the best way to hook everything together and have it work.
The flow should be :
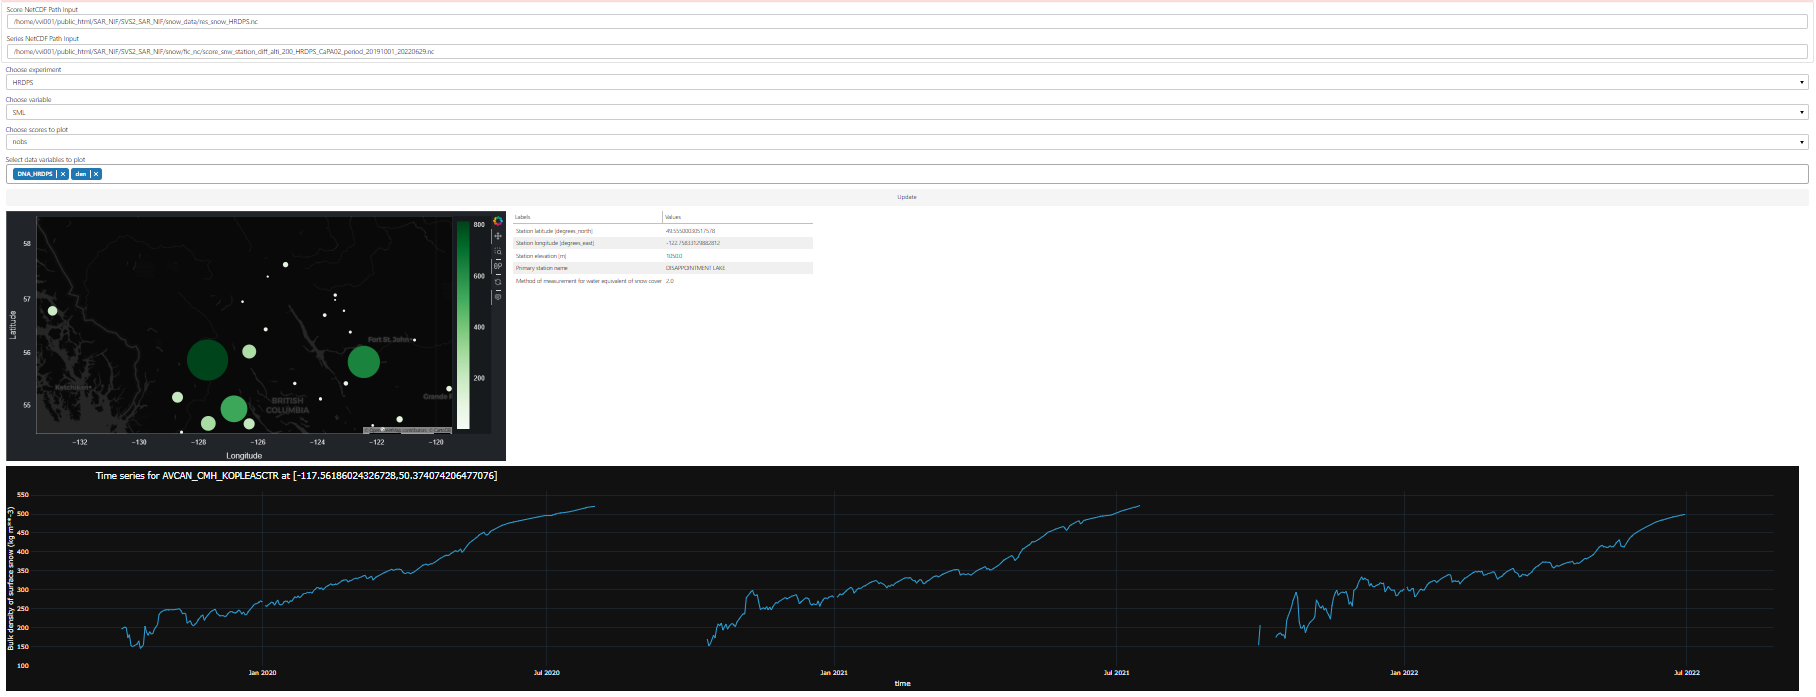
- Enter paths to NetCDFs
- Choose some options and click update to populate the map with meteo stations (colormap and size depending on one of the selects as
hv.dim(...)) - Click on map to get closest statio which updates Plotly graph and table using the options and tap coordinates.
Here is a screenshot of when it is working and I am very ashamed of the quality of the code but that is why this is the part of the movie where the teacher appears and shows me how to wax on/wax off properly … hopefully ![]()
import geoviews as gv
import geoviews.tile_sources as gvt
import xarray as xr
import holoviews as hv
import panel as pn
import hvplot.xarray
import pandas as pd
from panel.widgets import MultiChoice, Select
from holoviews.operation.datashader import datashade, rasterize
from holoviews.util.transform import easting_northing_to_lon_lat as to_lon_lat
from bokeh.models import HoverTool
from plotly.graph_objects import Figure
from math import sqrt
import param

pn.extension(
    'plotly',
    loading_spinner="arcs",
    loading_color="#3ef211",
    sizing_mode="stretch_width",
    template="material",
    theme='dark'
)
pn.state.template.param.update(
    site="CMDS Data Viz", title=" Mr. Vionnet Bokeh"
)


def closest_station(station_ids, latitudes, longitudes, lat, lon) -> hvplot:
    min_distance = None
    closest_station_id = None
    for i in range(len(station_ids)):
        distance = sqrt((lat - latitudes[i]) ** 2 + (lon - longitudes[i]) ** 2)
        if min_distance is None or distance < min_distance:
            min_distance = distance
            closest_station_id = station_ids[i]
    return closest_station_id

def get_station_hvplot(self, ds_plot: xr.Dataset, nearest_station_id: str, new_title: str):
    set_data_vars = set(self.DATA_VARIABLE_MULTI_SELECT.value)
    scatter_plots = ds_plot.sel(station_id=nearest_station_id).hvplot.scatter(
        x="time", y=list(self.SET_SCATTER_VARS_PLOT.intersection(set_data_vars))
    )
    line_plots = ds_plot.sel(station_id=nearest_station_id).hvplot.line(
        x="time", y=list(self.SET_LINE_VARS_PLOT.intersection(set_data_vars))
    )
    out_plot = scatter_plots * line_plots
    return Figure(hvplot.render(out_plot, backend="plotly")).update_layout(
        title=new_title,
        hovermode="x",
        template="plotly_dark",
        autosize=True,
        width=None,
        height=None,
    )

class SnowExplorer(param.Parameterized):
    def __init__(self):
        self.stations_df = pd.read_parquet(
            "PATH/TO/stations_df.pq"
        )
        self.score_select = pn.widgets.TextInput(
            name="Score NetCDF Path Input",
            value="PATH/TO/res_snow_HRDPS.nc",
        )
        self.series_select = pn.widgets.TextInput(
            name="Series NetCDF Path Input",
            value=(
                "PATH/TO/"
                "score_snw_station_diff_alti_200_HRDPS_CaPA02_period_20191001_20220629.nc"
            ),
        )
        self.score_ds = xr.open_dataset(self.score_select.value)  # plot_ds
        self.series_ds = xr.open_dataset(self.series_select.value)  # ds

        # Constants
        self.SET_EXCLUDED_VARS = set(
            ["lat", "lon", "elevation", "source", "station_name", "type_mes"]
        )
        self.SET_EXCLUDED_VARS_PLOT = set(
            [
                "lat",
                "lon",
                "Elevation_HRDPS",
                "elevation",
                "source",
                "station_name",
                "type_mes",
            ]
        )
        self.SET_SCATTER_VARS_PLOT = set(["snw", "snd", "den"])
        self.hover = HoverTool(tooltips=[("Station ID", "@station_id"),("Station Name", "@station_name"),('Root Mean Square Error','@rmse')])
        self.test_df = self.series_ds.isel(time=0).sel(variable='SML',exp='HRDPS').to_pandas()
        self.test_df.reset_index(inplace=True)
        self.map_out = gv.tile_sources.CartoDark() * gv.Points(self.test_df, ['lon','lat'],['rmse','station_id','station_name']).options(
            height=500,
            width=1000,
            color=hv.dim('rmse'),
            size=hv.dim('rmse')*0.1,
            colorbar=True,
            cmap="Greens",
            clipping_colors={"min": "red"},
            tools=[self.hover]
        )
        def hide_index(plot, element):
            plot.handles['table'].index_position = None

        def tap_info(x, y):
            print(x,y)
            lon_lat = to_lon_lat(x, y)
            nearest_station = closest_station(
                    self.LIST_STATION_IDS_PLOT,
                    self.LIST_LATS_PLOT,
                    self.LIST_LONS_PLOT,
                    lon_lat[1],
                    lon_lat[0],
                )
            new_title = f"Time series for {nearest_station} at [{lon_lat[0]},{lon_lat[1]}]"
            self.hvplot_row.clear()
            self.hvplot_row.append(get_station_hvplot(self, self.score_ds, nearest_station, new_title))
            ns_attrs = self.series_ds.sel(station_id=nearest_station)
            vt = [
                float(ns_attrs.lat.values),
                float(ns_attrs.lon.values),
                float(ns_attrs.elevation.values),
                str(ns_attrs.station_name.values),
                str(ns_attrs.type_mes.values)
            ]
            lt = [
                f"{ns_attrs.lat.long_name} [{ns_attrs.lat.units}]",
                f"{ns_attrs.lon.long_name} [{ns_attrs.lon.units}]",
                f"{ns_attrs.elevation.long_name} [{ns_attrs.elevation.units}]",
                f"{ns_attrs.station_name.long_name}",
                f"{ns_attrs.type_mes.long_name}"
            ]
            return hv.Table({'Labels':lt, 'Values':vt}, ['Labels','Values']).opts(width=600, hooks=[hide_index])

        self.ts_dt = hv.streams.Tap(source=self.map_out, x=-122.76, y=49.555)
        self.tap_dmap = hv.DynamicMap(tap_info, streams=[self.ts_dt])
        # Options
        self.variables_list = list(self.series_ds.variable.values)
        self.experiments_list = list(self.series_ds.exp.values)
        self.set_data_vars = set(self.series_ds.data_vars.keys())
        self.SET_SCORES = self.set_data_vars - self.SET_EXCLUDED_VARS

        self.LIST_STATION_IDS_PLOT = list(self.score_ds.station_id.values)
        self.LIST_LATS_PLOT = list(self.score_ds.lat.values)
        self.LIST_LONS_PLOT = list(self.score_ds.lon.values)
        self.SET_DATA_VARS_PLOT = set(self.score_ds.data_vars.keys())
        self.SET_LINE_VARS_PLOT = (
            self.SET_DATA_VARS_PLOT
            - self.SET_EXCLUDED_VARS_PLOT
            - self.SET_SCATTER_VARS_PLOT
        )

        self.VARIABLE_SELECT = Select(
            name="Choose variable",
            value=self.variables_list[0],
            options=self.variables_list,
        )
        self.EXP_SELECT = Select(
            name="Choose experiment",
            value=self.experiments_list[0],
            options=self.experiments_list,
        )
        self.DATA_VARS_SELECT = Select(
            name="Choose scores to plot",
            value=list(self.SET_SCORES)[0],
            options=list(self.SET_SCORES),
        )

        self.DATA_VARIABLE_SELECT_OPTIONS = list(
            self.SET_DATA_VARS_PLOT - self.SET_EXCLUDED_VARS_PLOT
        )
        self.DATA_VARIABLE_MULTI_SELECT = pn.widgets.MultiChoice(
            name="Select data variables to plot",
            value=self.DATA_VARIABLE_SELECT_OPTIONS[0:2],
            options=self.DATA_VARIABLE_SELECT_OPTIONS,
        )
        self.update_button = pn.widgets.Button(name='Update')

        self.INITIAL_HVPLOT = get_station_hvplot(self, self.score_ds, "BCE-1C08", 'Whatever')
        self.hvplot_row = pn.Row(self.INITIAL_HVPLOT)

    @pn.depends("update_button.value")
    def view(self):
        try:
            self.score_ds = xr.open_dataset(self.score_select.value)
            self.series_ds = xr.open_dataset(self.series_select.value)

            self.variables_list = list(self.series_ds.variable.values)
            self.experiments_list = list(self.series_ds.exp.values)
            self.set_data_vars = set(self.series_ds.data_vars.keys())
            self.SET_SCORES = self.set_data_vars - self.SET_EXCLUDED_VARS

            self.LIST_STATION_IDS_PLOT = list(self.score_ds.station_id.values)
            self.LIST_LATS_PLOT = list(self.score_ds.lat.values)
            self.LIST_LONS_PLOT = list(self.score_ds.lon.values)
            self.SET_DATA_VARS_PLOT = set(self.score_ds.data_vars.keys())
            self.SET_LINE_VARS_PLOT = (
                self.SET_DATA_VARS_PLOT
                - self.SET_EXCLUDED_VARS_PLOT
                - self.SET_SCATTER_VARS_PLOT
            )

            self.VARIABLE_SELECT.options = self.variables_list
            self.VARIABLE_SELECT.value = self.variables_list[0]

            self.EXP_SELECT.options = self.experiments_list
            self.EXP_SELECT.value = self.experiments_list[0]

            self.DATA_VARS_SELECT.options = list(self.SET_SCORES)
            self.DATA_VARS_SELECT.value = list(self.SET_SCORES)[0]

            self.DATA_VARIABLE_SELECT_OPTIONS = list(
                self.SET_DATA_VARS_PLOT - self.SET_EXCLUDED_VARS_PLOT
            )

            self.DATA_VARIABLE_MULTI_SELECT.options = self.DATA_VARIABLE_SELECT_OPTIONS
            self.DATA_VARIABLE_MULTI_SELECT.value = self.DATA_VARIABLE_SELECT_OPTIONS[
                0:2
            ]
        except Exception as e:
            print(e)

app = SnowExplorer()

pn.Column(
    pn.WidgetBox(app.score_select, app.series_select),
    pn.Column(
        app.EXP_SELECT,
        app.VARIABLE_SELECT,
        app.DATA_VARS_SELECT,
        app.DATA_VARIABLE_MULTI_SELECT,
        app.update_button,

    ),
    pn.Row(app.map_out , app.tap_dmap),
    app.hvplot_row
)