Hi Holoviz Community.
I would like to post my app to the community in exchange for requesting code reviews and some help with troubleshooting ![]() You may also find the content interesting.
You may also find the content interesting.
The work is inspired by this paper:
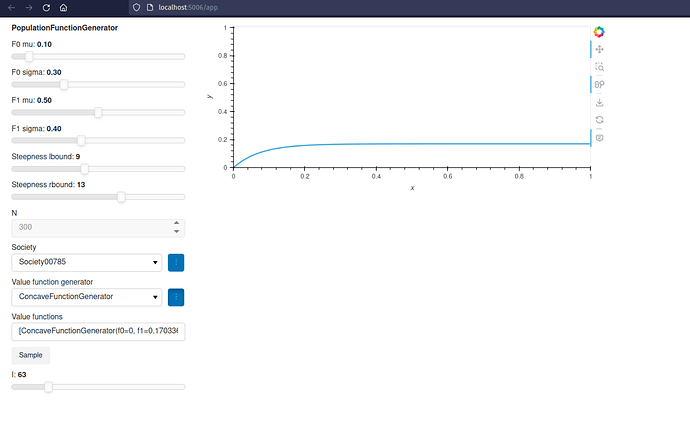
The app so far looks like this:
import hvplot.pandas
import numbergen as ng
import numpy as np
import pandas as pd
import panel as pn
import param as pm


class Society(pm.Parameterized):
    N = pm.Integer(default=30, bounds=(1, None))
    C = pm.Integer(default=20, bounds=(1, None))
    P = pm.Integer(default=10, bounds=(1, None))
    society = pm.List(precedence=1)
    community = pm.List(precedence=1)
    public_goods = pm.List(precedence=1)
    sample = pm.Action(lambda self: self._sample())

    def __init__(self, **params):
        super().__init__(**params)
        self._sample()

    @pm.depends('N', 'C', 'P', watch=True)
    def _sample(self):
        self.society = list(range(self.N))
        self.community = list(
            np.random.choice(a=list(self.society), size=self.C, replace=False, p=None)
        )
        self.public_goods = list(
            enumerate(
                np.random.choice(
                    a=list(self.community),
                    size=self.P,
                    replace=True,
                    p=None,
                )
            )
        )

    def text_view(self):
        text = f"""
            Number of Citizens in the Society: **{self.N}**\n
            Community Size: **{self.C}**\n
            Number of Public Goods: **{self.P}**\n
            Society: **{self.society}**\n
            Community: **{self.community}**\n
            Public Goods: **{self.public_goods}**"""
        return pn.pane.Markdown(text)

    def view(self):
        """🌶️"""
        return pn.Row(self, self.text_view)


society = Society()


class ConcaveFunctionGenerator(pm.Parameterized):
    f0 = pm.Number(default=0.2, bounds=(0, 1), doc='Value of f(0)')
    f1 = pm.Number(default=0.8, bounds=(0, 1), softbounds=(0, 1), doc='Value of f(1)')
    steepness = pm.Number(default=5, bounds=(1, 20), doc='Steepness of the curve')

    def __init__(self, **params):
        super().__init__(**params)
        self._update_f1_bounds()

    @pm.depends('f0', watch=True)
    def _update_f1_bounds(self):
        # Clip the value of f1 if it's below f0
        self.f1 = max(self.f0, self.f1)

        # Update the lower bound of f1 to be the value of f0
        self.param['f1'].bounds = (self.f0, 1)

    def x(self):
        return np.linspace(0, 1, 400)

    def f(self, x):
        # Using the negative exponential function as a base
        y = 1 - np.exp(-self.steepness * x)

        # Adjusting the function to start at f0 and end at f1
        y = self.f0 + (self.f1 - self.f0) * (y - y.min()) / (y.max() - y.min())

        return y

    def chart_view(self):
        x = self.x()
        y = self.f(x)
        df = pd.DataFrame({'x': x, 'y': y})
        return df.hvplot.line(x='x', y='y', ylim=(0, 1.01))

    def view(self):
        return pn.Row(self, self.chart_view)


concave_gen = ConcaveFunctionGenerator()

app = pn.Column(society.view(), concave_gen.view())


class PopulationFunctionGenerator(pm.Parameterized):
    f0_mu = pm.Number(default=0.1, bounds=(0, 1), doc='Mean Value of f(0)')
    f0_sigma = pm.Number(default=0.3, bounds=(0, 1), doc='Standard Deviationn of f(0)')
    f1_mu = pm.Number(default=0.5, bounds=(0, 1), doc='Mean Value of f(1)')
    f1_sigma = pm.Number(default=0.4, bounds=(0, 1), doc='Standard Deviationn of f(1)')
    steepness_lbound = pm.Integer(
        default=1, bounds=(1, 20), doc='Lower Bound of Steepness'
    )
    steepness_rbound = pm.Integer(
        default=20, bounds=(1, 20), doc='Upper Bound of Steepness'
    )
    n = pm.Integer(constant=True)
    society = pm.Selector(default=society, objects=[society], instantiate=True)
    value_function_generator = pm.Selector(
        default=ConcaveFunctionGenerator,
        objects=[ConcaveFunctionGenerator],
        instantiate=True,
    )
    value_functions = pm.List()
    sample = pm.Action(lambda self: self._sample(), instantiate=True)

    i = pm.Integer(0)

    def __init__(self, **params):
        super().__init__(**params)
        self._update()
        self._sample()

    @pm.depends('society.public_goods', 'society.society', watch=True)
    def _update(self):
        with pm.edit_constant(self):
            self.n = len(self.society.public_goods) * len(self.society.society)
        self.param['i'].bounds = (0, self.n - 1)

    @pm.depends('steepness_lbound', watch=True)
    def _update_steepness_rbound_bounds(self):
        # Clip the value of f1 if it's below f0
        self.steepness_rbound = max(self.steepness_lbound, self.steepness_rbound)

        # Update the lower bound of f1 to be the value of f0
        self.param['steepness_rbound'].bounds = (self.steepness_lbound, 20)

    # fix this so the parameters are from this class
    def concave_function_parameters_generator(self):
        return dict(
            f0=ng.BoundedNumber(
                generator=ng.NormalRandom(mu=self.f0_mu, sigma=self.f0_sigma),
                bounds=(0, 1),
            )(),
            f1=ng.BoundedNumber(
                generator=ng.NormalRandom(mu=self.f1_mu, sigma=self.f1_sigma),
                bounds=(0, 1),
            )(),
            steepness=ng.UniformRandom(
                lbound=self.steepness_lbound, ubound=self.steepness_rbound
            )(),
        )

    @pm.depends(
        'steepness_lbound',
        'steepness_rbound',
        'f0_mu',
        'f0_sigma',
        'f1_mu',
        'f1_sigma',
        watch=True,
    )
    def _sample(self):
        value_functions = [
            self.value_function_generator(
                **self.concave_function_parameters_generator()
            )
            for p_i in range(self.n)
        ]

        self.value_functions = value_functions

    # @pm.depends('i')
    def samples_view(self):
        return self.value_functions[self.i].chart_view()

    @pm.depends('i', 'steepness_lbound')
    def view(self):
        return pn.Row(self, self.samples_view())


population_function_generator = PopulationFunctionGenerator(
    society=society,
    value_function_generator=ConcaveFunctionGenerator,
)

app = population_function_generator.view()


if __name__ == '__main__':
    print(society)
    print(concave_gen)
    print(population_function_generator)
    print('here')
I’m aiming to work my way through the paper in the form of a panel app. The following is an approach to sampling concave, smooth, increasing functions.
The app is deployed with:
panel serve app/app.py --autoreload
Problem #1: the above is not re-drawing at
population_function_generator.view()
ie. the chart is not redrawing when I slide i at the bottom.
Problem #2: The toggle buttons are not working for the Selector Drop Downs. The expand functionality.
I read through the following resource:
https://panel.holoviz.org/how_to/param/subobjects.html
Which I posted a minimum example here: Panel Selector Expand Not Working After Restarting Server - #3 by LinuxIsCool
In general, you can follow the developments here:
Holoviz community rocks ![]()
