Yes. I did it. But it does not work.
path = [
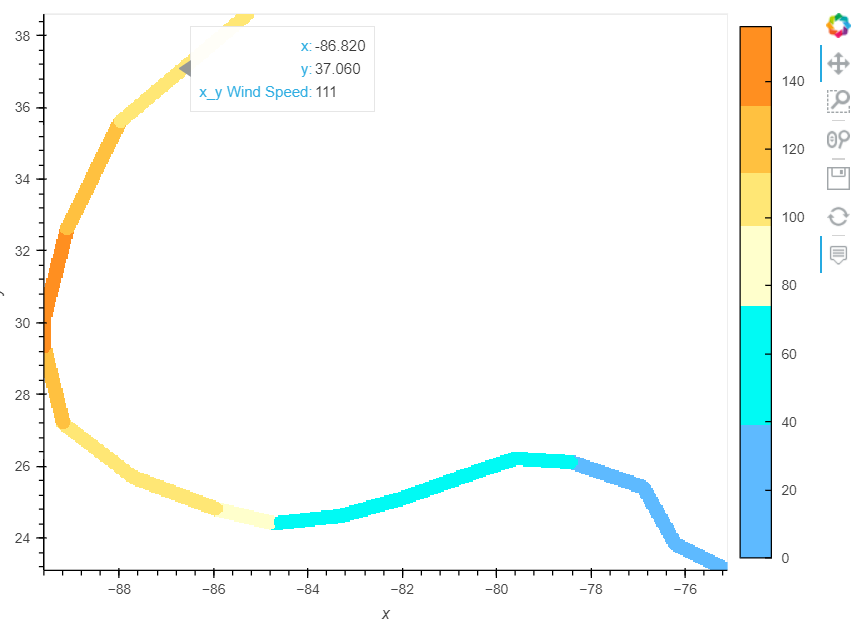
(-75.1, 23.1, 0, ‘a’), (-76.2, 23.8, 0, ‘a’), (-76.9, 25.4, 0, ‘b’), (-78.4, 26.1, 39, ‘c’), (-79.6, 26.2, 39, ‘c’),
(-80.3, 25.9, 39, ‘d’), (-82.0, 25.1, 74, ‘d’), (-83.3, 24.6, 74, ‘d’), (-84.7, 24.4, 96, ‘v’), (-85.9, 24.8, 111, ‘v’),
(-87.7, 25.7, 111, ‘v’), (-89.2, 27.2, 131, ‘f’), (-89.6, 29.3, 156, ‘f’), (-89.6, 30.2, 156, ‘f’), (-89.1, 32.6, 131, ‘g’),
(-88.0, 35.6, 111, ‘g’), (-85.3, 38.6, 96, ‘g’)
]
spread(rasterize(hv.Path([path], vdims=[‘Wind Speed’,‘level’]), aggregator=‘mean’), how=‘source’, px=5).opts(width=700, cmap=colors, color_levels=levels, height=500,colorbar=True, tools=[‘hover’])