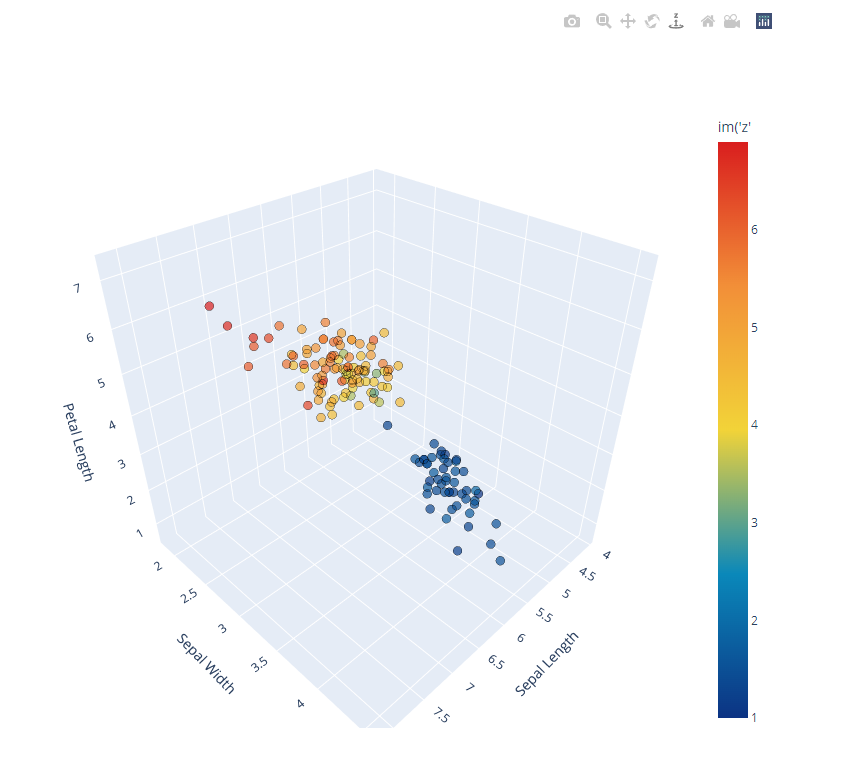
Yes I can reproduce your work however the issue is the labelling of the colorbar legend with the string: “im(‘z’”. I had hoped that this this colorbar string value could be set by the user (potentially to reflect a meaning value like the name of the dimension it represents).
One thing I haven’t tried is to extract the Holoviz object out into a plotly object and try and configure it there with that.
In any case it’s a minor issue.
I think 3d scatter plots are underrated ( mindful if the visualisation rule 101 of not plotting quantitate data in 3D ) since they present the opportunity for a “bird’s eye view” to appreciate potential clustering and anomalies. I’m hoping Plotly will some day present the capability to select a user defining subset of points in the 3D scatter plot with say a plane (from square / rectangular selection) followed by extrusion orthogonally. A point project to sphere or disc to cylinder might be interesting candidates also.