Hi, everyone, i’m trying to plot the following xarray (BTC orderbook data) as a heatmap (non categorical so image or quadmesh in my case):
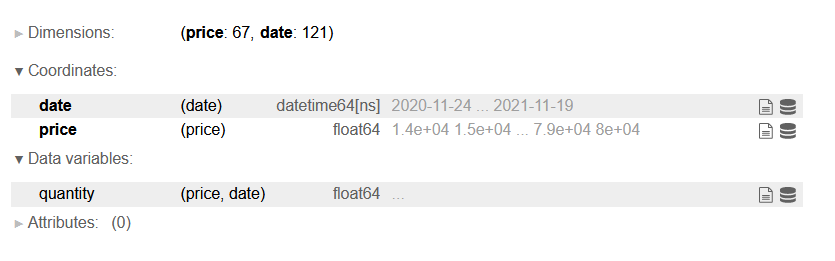
The idea will be that i can use a flag in my code to change the backend and to produce the exact same plot structure, so going from a non interactive MPL to an interactive plotly (preferrence) or bokeh.
The issue comes when trying to add changes to the colorbar, the following code outputs the good plot on bokeh but doesnt on plotly or MPL:
hv.extension('matplotlib')
hv.QuadMesh(xr_qty, kdims=["date", "price"]).opts(colorbar=True,
                                                  height=450,
                                                  width=900,
                                                  fig_size=400,
                                                  fontsize=12,
                                                  aspect=2,
                                                  cmap = 'viridis',
                                                  colorbar_position='top')
I also tried to add colorbar_opts={‘location’:‘top’} like it’s specified on mpl hist2d but it raises
__init__() got an unexpected keyword argument 'location'
(for plotly it raises Invalid property specified for object of type plotly.graph_objs.heatmap.ColorBar: ‘location’ but it makes sense)