Hi all,
is that possible to combine gdf plot with data from different dataframe, my code:
import geopandas as gpd
import pandas as pd
import hvplot.pandas
from shapely.geometry import Point
#import shapely

# Create a GeoDataFrame with a Point geometry column
#data = {'geometry': [Point(-74.005974, 40.712776), Point(-73.986259, 40.748817)]}
gdf = gpd.read_file('https://github.com/opengeos/leafmap/raw/master/examples/data/cable_geo.geojson')

# Extract latitude and longitude into new columns
#gdf['latitude'] = gdf.geometry.y
#gdf['longitude'] = gdf.geometry.x

# Sample DataFrames (replace these with your actual data)
df1_data = {'latitude': [40.712776, 40.748817], 'longitude': [-74.005974, -73.986259], 'value1': [10, 20]}
df1 = pd.DataFrame(df1_data)

df2_data = {'latitude': [40.712776, 40.748817], 'longitude': [-74.005974, -73.986259], 'value2': [30, 40]}
df2 = pd.DataFrame(df2_data)

# Display the GeoDataFrame
a=gdf.hvplot(geo=True, line_color='blue', line_width=1,  frame_width=400, frame_height=400)
b=df1.hvplot(x='longitude',y='latitude', line_color='red', line_width=3,  frame_width=400, frame_height=400)
a*b
result:
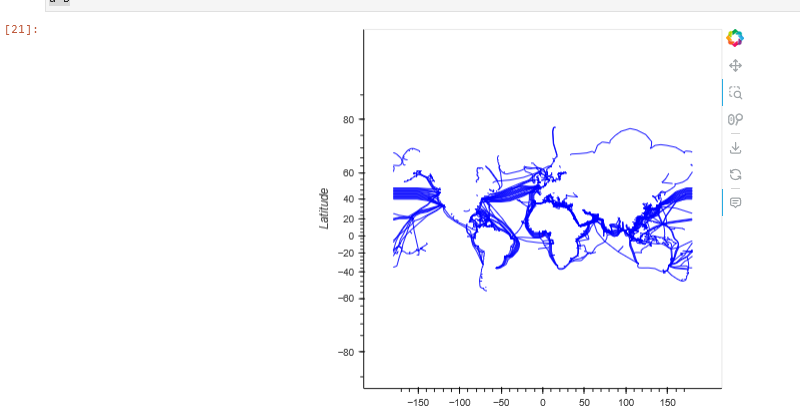
only a plotted no b bplot. kindly please advise.
thanks