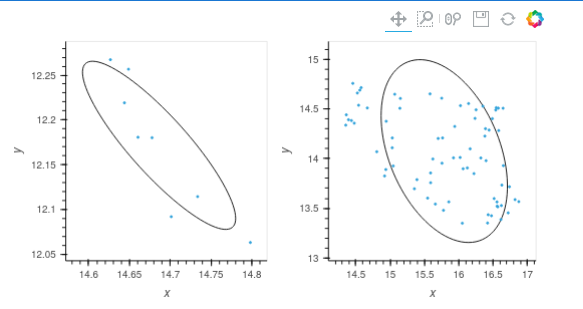
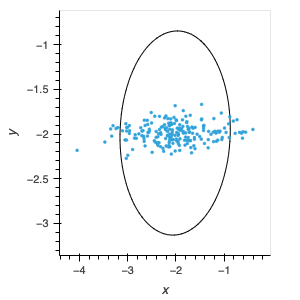
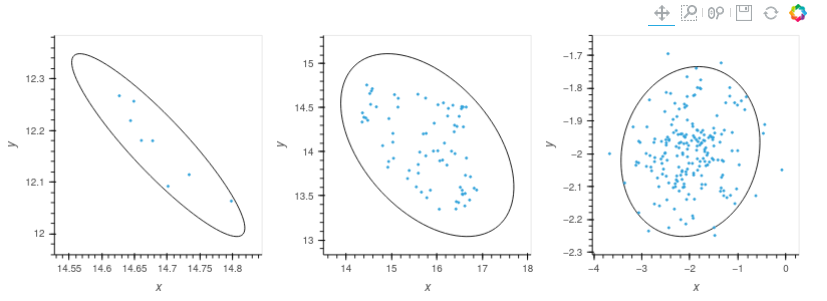
I would like to encircle my scatter plot data with a measure of standard deviation. Unfortunately I can’t seem to get the orientation setting right. I am confused by the available descriptions:
Orientation in the Cartesian coordinate system, the
counterclockwise angle in radians between the first axis and the
horizontal
and
you can set the orientation (in radians, rotating anticlockwise)
My script and data example:
def eigsorted(cov):
    vals, vecs = np.linalg.eigh(cov)
    order = vals.argsort()[::-1]
    return vals[order], vecs[:,order]

def encircle(x, y, nstd = 3):
    cov = np.cov(x, y)
    vals, vecs = eigsorted(cov)
    theta = np.degrees(np.arctan2(*vecs[:,0][::-1]))
    w, h = 2 * nstd * np.sqrt(vals)
    return h, w, theta

def list_polygon(_dict):
    list_polygons = []
    for key in _dict.keys():
        _polygon = hv.Polygons([{('x', 'y'): hv.Ellipse(np.mean(_dict[key][0]), np.mean(_dict[key][1]), (_dict[key][2], _dict[key][3]), orientation=(_dict[key][4]**0.01745)).array()}]).opts(color=_dict[key][5])
        # _polygon = hv.Ellipse(_dict[key][0], _dict[key][1], (_dict[key][2], _dict[key][3]), (_dict[key][4]/360)*np.pi).opts(color=_dict[key][5])
        list_polygons.append(_polygon)
    return list_polygons


array_0_x = [14.626729965209961, 14.648904800415039, 14.733654975891113, 14.798286437988281, 14.643913269042969, 14.677755355834961, 14.66055965423584, 14.70136833190918]
array_0_y = [12.267253875732422, 12.25666618347168, 12.114402770996094, 12.063163757324219, 12.219114303588867, 12.180122375488281, 12.18067741394043, 12.09195613861084]
array_0_h, array_0_w, array_0_theta = encircle(x = array_0_x, y = array_0_y, nstd = 3)

array_1_x = [16.06388282775879, 16.12518882751465, 15.923401832580566, 16.020185470581055, 15.066932678222656, 15.149603843688965, 14.54041862487793, 14.667778015136719, 15.142616271972656, 16.650007247924805, 16.62876319885254, 14.558774948120117, 14.456321716308594, 16.539690017700195, 16.380924224853516, 16.166292190551758, 16.25292205810547, 16.322223663330078, 16.442623138427734, 15.941734313964844, 16.143335342407227, 15.581430435180664, 15.751699447631836, 16.820762634277344, 16.720598220825195, 14.522720336914062, 14.577762603759766, 16.8760929107666, 16.73967742919922, 16.02482032775879, 16.420291900634766, 16.490720748901367, 16.23689842224121, 16.389381408691406, 16.352201461791992, 16.477752685546875, 16.428762435913086, 16.615528106689453, 16.56000328063965, 16.546770095825195, 16.576906204223633, 16.646148681640625, 16.582895278930664, 15.764276504516602, 15.700431823730469, 14.943675994873047, 14.805766105651855, 14.361465454101562, 14.47752571105957, 16.05176544189453, 15.777639389038086, 14.393733024597168, 14.353582382202148, 15.59047794342041, 15.354070663452148, 16.22173309326172, 16.398263931274414, 15.546730041503906, 15.855430603027344, 14.920063018798828, 15.045196533203125, 15.030611038208008, 15.031574249267578, 15.65877628326416, 14.43680191040039, 14.937338829040527, 15.756300926208496, 15.589689254760742, 15.390737533569336, 15.623208045959473, 16.569225311279297, 16.62229347229004, 16.51552963256836, 16.557403564453125]
array_1_y = [13.897571563720703, 13.906061172485352, 14.007840156555176, 14.011129379272461, 14.648042678833008, 14.606070518493652, 14.537391662597656, 14.50973892211914, 14.506791114807129, 13.92885684967041, 13.733349800109863, 14.689118385314941, 14.757230758666992, 14.488571166992188, 14.226333618164062, 14.098344802856445, 14.49145221710205, 14.006555557250977, 14.287406921386719, 14.323968887329102, 14.55444049835205, 14.651986122131348, 14.60823917388916, 13.58717155456543, 13.453489303588867, 14.660158157348633, 14.714993476867676, 13.566643714904785, 13.716506004333496, 14.53334903717041, 13.351394653320312, 14.401777267456055, 14.404946327209473, 14.301204681396484, 14.527425765991211, 13.424491882324219, 13.43462085723877, 13.386327743530273, 13.521247863769531, 14.512731552124023, 14.508121490478516, 14.507160186767578, 14.282684326171875, 14.207962989807129, 14.202638626098633, 14.375961303710938, 14.069111824035645, 14.440964698791504, 14.35629940032959, 13.349201202392578, 13.479074478149414, 14.391450881958008, 14.337162971496582, 13.757364273071289, 13.696568489074707, 13.849023818969727, 13.97883415222168, 13.602248191833496, 13.564446449279785, 13.82508659362793, 13.92595386505127, 14.109186172485352, 14.207939147949219, 13.542155265808105, 14.383004188537598, 13.889872550964355, 13.953922271728516, 13.855619430541992, 13.788017272949219, 13.995970726013184, 13.514547348022461, 13.527362823486328, 13.59772777557373, 13.563745498657227]
array_1_h, array_1_w, array_1_theta = encircle(x = array_1_x, y = array_1_y, nstd = 3)


_dict = {0: [array_0_x,
  array_0_y,
  array_0_h,
  array_0_w,
  array_0_theta,
  'rgba(31,119,180,0.5)'],
 1: [array_1_x,
  array_1_y,
  array_1_h,
  array_1_w,
  array_1_theta,
  'rgba(31,119,180,0.5)']}

list_polygons = list_polygon(_dict)
hv.Overlay(list_polygons) * hv.Points((array_0_x, array_0_y)) * hv.Points((array_1_x, array_1_y))