ktyle
September 21, 2023, 6:58pm
1
In an environment running an up-to-date Holoviz set of packages:
geoviews = 1.10.1
holoviews = 1.17.1
bokeh = 3.2.2
panel = 1.2.3
I’ve discovered that both line and filled contours do not properly display if Matplotlib 3.8.0 is installed. Things work properly with MPL 3.7.3.
Here is a fully-reproducible code block:
import matplotlib.pyplot as plt
import cartopy.crs as ccrs
import cartopy.feature as cfeature
import geoviews as gv
from geoviews import opts

gv.extension('bokeh')

Z = xr.open_dataset('http://thredds.atmos.albany.edu:8080/thredds/dodsC/atm533/2012103000_z500_era5.nc').z

gds= gv.Dataset(Z.isel(time=0), kdims=['longitude','latitude'], vdims=['z'])
contour = gv.project(gds.to(gv.LineContours, ['longitude', 'latitude'],crs=ccrs.PlateCarree()))
(gv.tile_sources.OSM * contour).opts(
    opts.LineContours(tools=['hover'], frame_width=700, frame_height=400,show_legend=True, line_width=3))
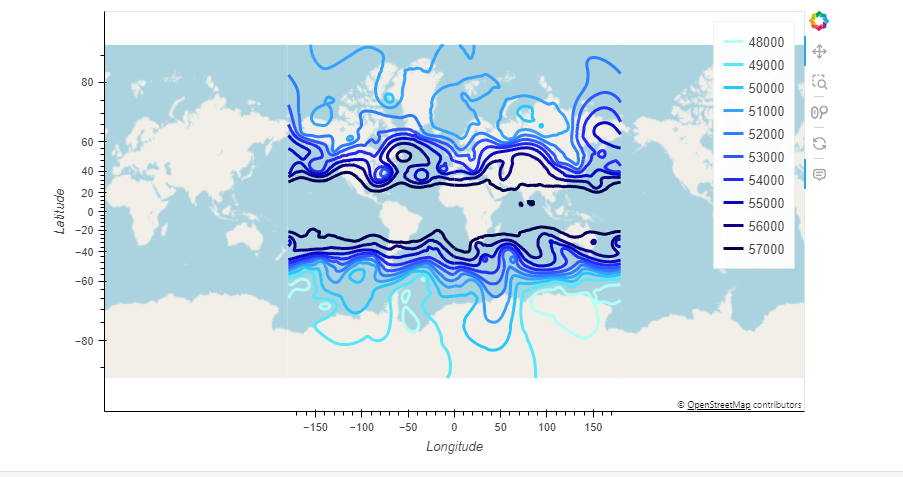
For Matplotlib <3.8, here is the (correct and expected) result:
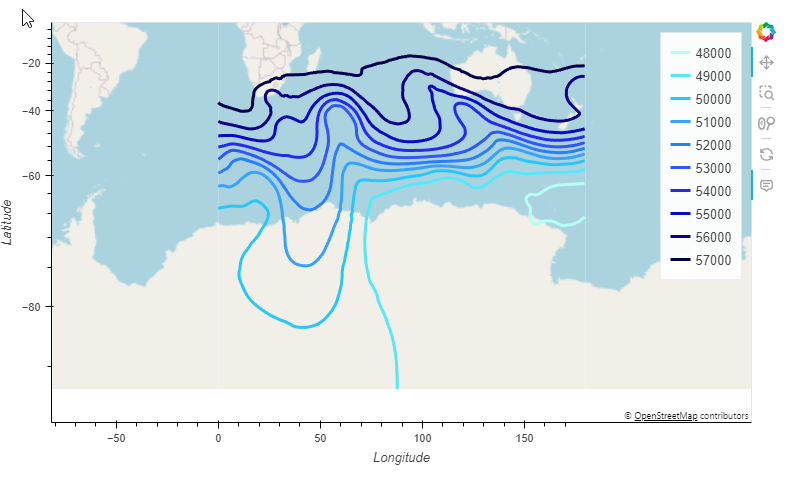
For Matplotlib 3.8.0, here is the result:
This misbehavior occurs in a variety of relevant recent package versions (e.g. cartopy, jupyterlab 3 and 4).
1 Like
Thanks for reporting this; would you mind opening an issue on GitHub? I was able to reproduce by upgrading to matplotlib==3.8.0.
Here’s the barebones:
import geoviews as gv
import xarray as xr

gv.extension("bokeh")

Z = xr.open_dataset(
    "http://thredds.atmos.albany.edu:8080/thredds/dodsC/atm533/2012103000_z500_era5.nc"
).z

gv.LineContours(Z.isel(time=0), kdims=["longitude", "latitude"], vdims=["z"])
ktyle
September 21, 2023, 8:19pm
3
Yeah I know! I kept trying different Holoviz-related package versions and after seeing no differences, I started casting a wider net and was surprised that it was Matplotlib, since I wasn’t even using its backend! I will open up an issue shortly, thanks!
I suppose it’s a HoloViews issue actually: holoviews.operation.element — HoloViews v1.17.1
    def _process(self, element, key=None):
        try:
            from matplotlib.contour import QuadContourSet
            from matplotlib.axes import Axes
            from matplotlib.figure import Figure
            from matplotlib.dates import num2date, date2num
        except ImportError:
            raise ImportError("contours operation requires matplotlib.")
        extent = element.range(0) + element.range(1)[::-1]
Or perhaps a matplotlib issue since we’re just using QuadContourSet?
Or because of this:https://matplotlib.org/stable/api/prev_api_changes/api_changes_3.8.0.html#contourset-is-now-a-single-collection
And we need to loop differently:
Prior to this release, ContourSet (the object returned by contour) was a custom object holding multiple Collections (and not an Artist) -- one collection per level, each connected component of that level's contour being an entry in the corresponding collection.

ContourSet is now instead a plain Collection (and thus an Artist). The collection contains a single path per contour level; this path may be non-continuous in case there are multiple connected components.
1 Like