I’ve got a dataframe where a column has 5 decimal places. In the hover tools of my dataframe it shows the data with 3 decimal places. Is there a way I can show the full 5 dp?
Thanks
I’ve got a dataframe where a column has 5 decimal places. In the hover tools of my dataframe it shows the data with 3 decimal places. Is there a way I can show the full 5 dp?
Thanks
Something like:
from bokeh.models import HoverTool
from bokeh.sampledata.periodic_table import elements

points = hv.Points(
    elements, ['electronegativity', 'density'],
    ['name', 'symbol', 'metal', 'CPK', 'atomic radius']
).sort('metal')

tooltips = [
    ('Name', '@name'),
    ('Symbol', '@symbol'),
    ('CPK', '$color[hex, swatch]:CPK')
]
hover = HoverTool(tooltips=tooltips)

points.opts(
    tools=[hover], color='metal', cmap='Category20',
    line_color='black', size=dim('atomic radius')/10,
    width=600, height=400, show_grid=True,
    title='Chemical Elements by Type (scaled by atomic radius)')
combined with Configuring plot tools — Bokeh 2.4.0 Documentation
May be a better example
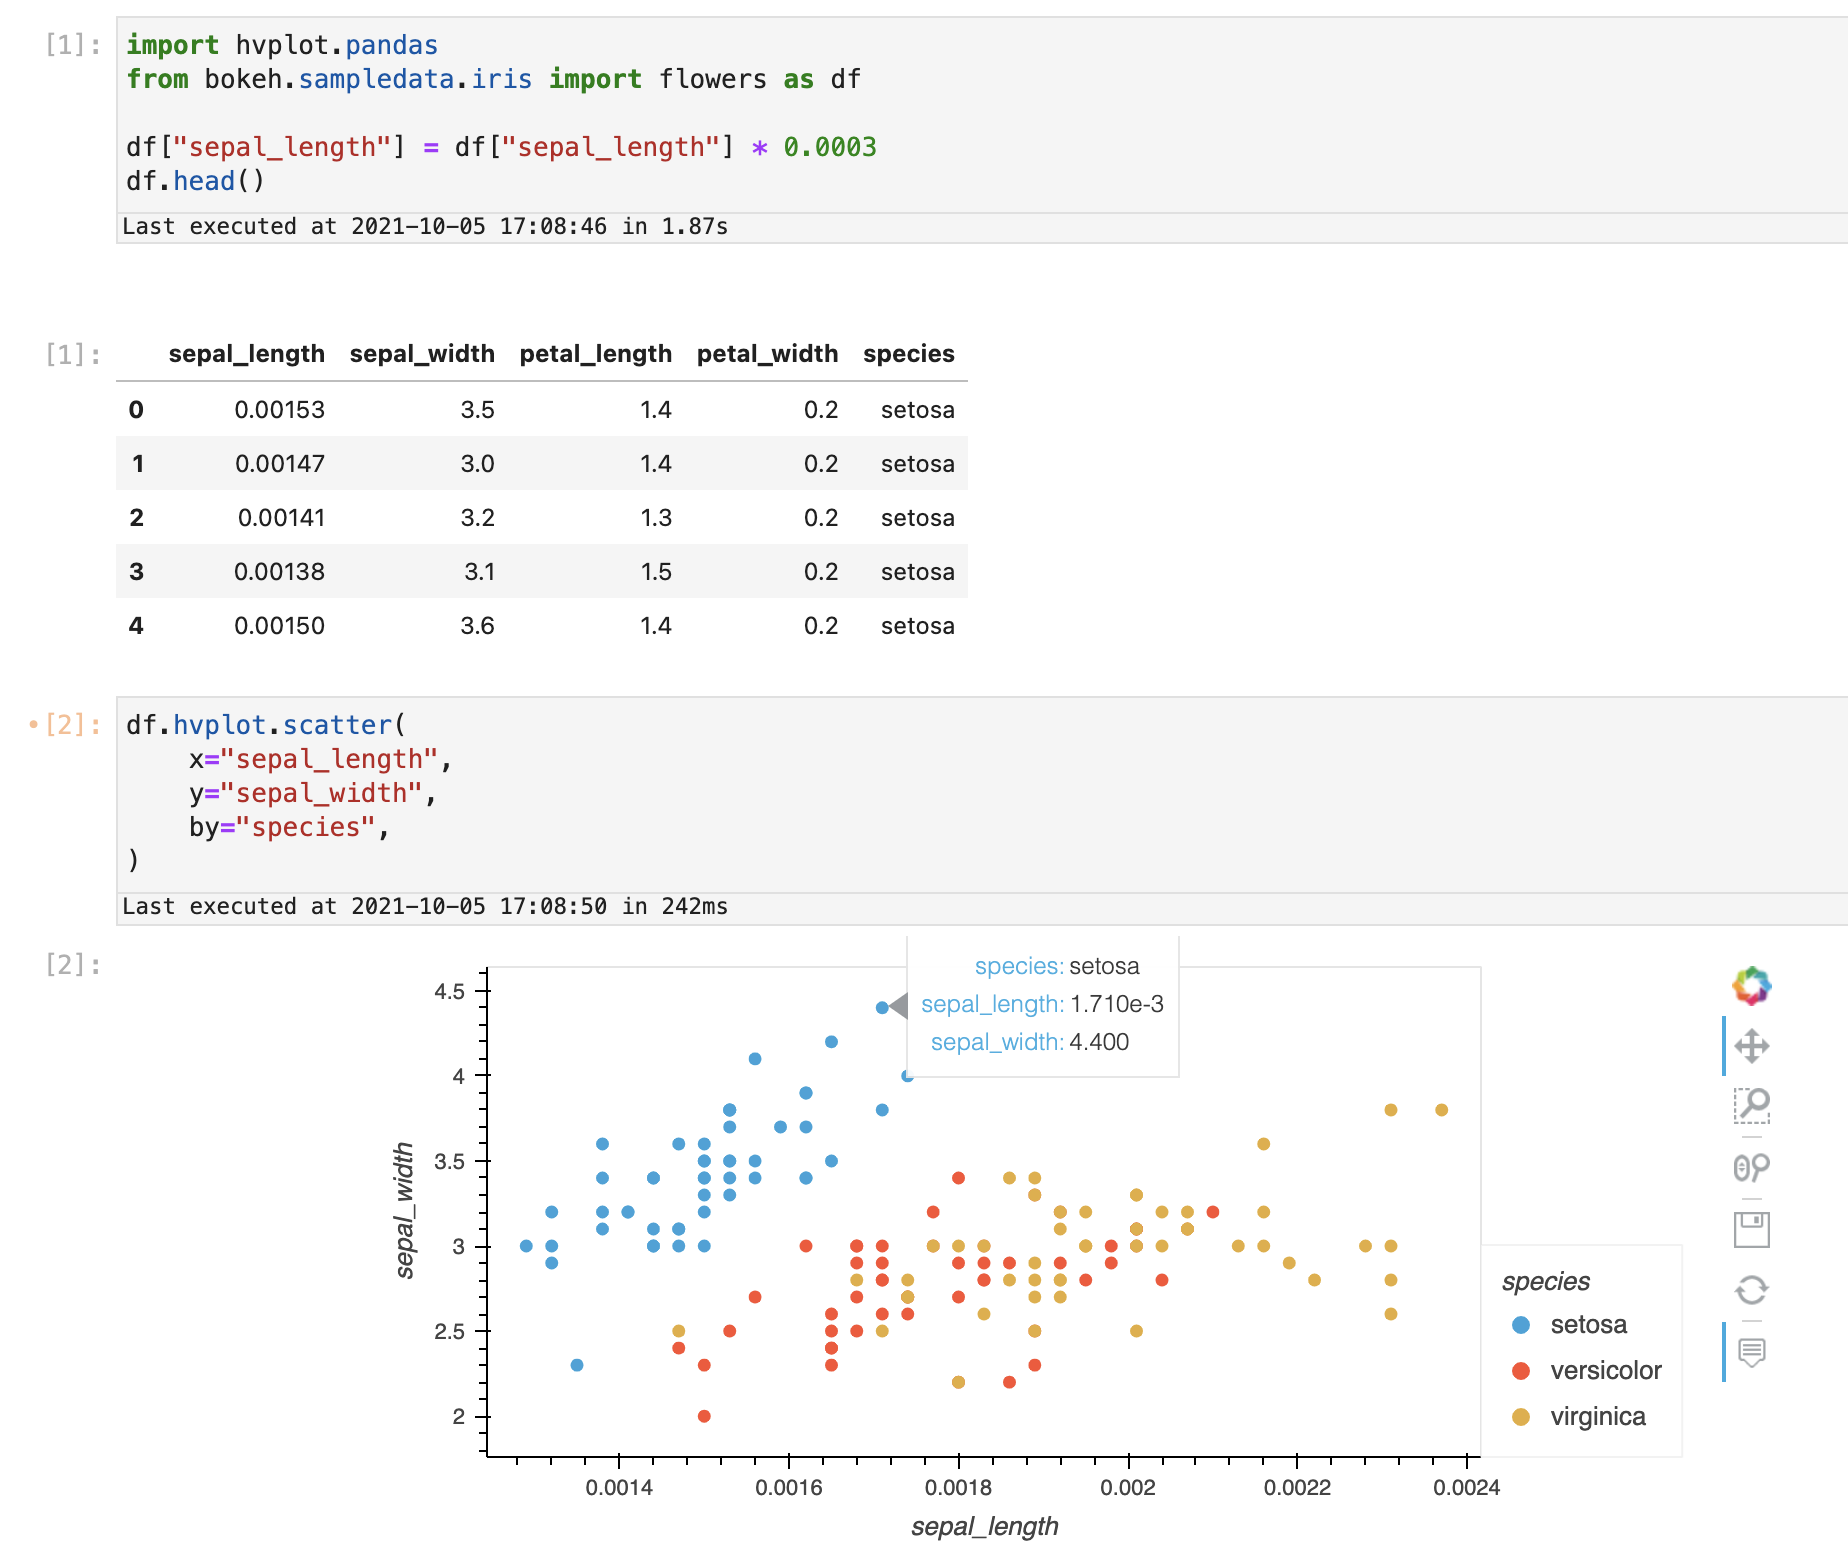
import hvplot.pandas
from bokeh.sampledata.iris import flowers as df

df["sepal_length"] = df["sepal_length"] * 0.0003
df.head()

df.hvplot.scatter(
    x="sepal_length",
    y="sepal_width",
    by="species",
)
to go from scientific notion to seeing the 5 dp.
This didn’t quite match code as i’m using something like geopandas.Dataframe.hvplot(hover_cols=[“timestamp”]). I’ll see if I can a better example for geo data.
I meant you have to specify
from bokeh.models import HoverTool

...opts(tools=[HoverTool(tooltips=...)])