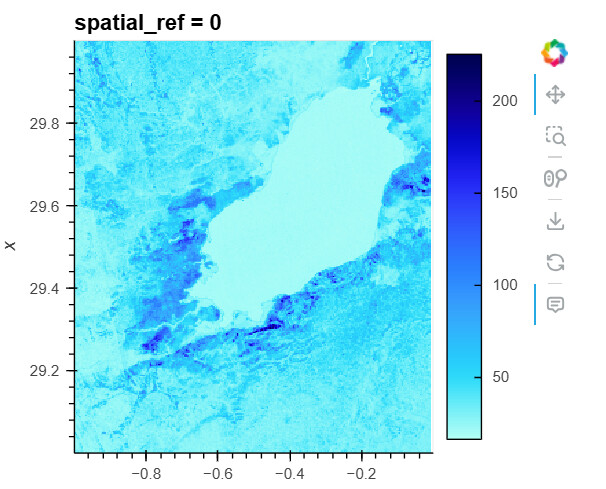
I’ve got a geotiff that is geolocated correctly in QGIS (so I know the CRS is correct), but when I load it with rioxarray into xarray I’m struggling to get it visualized correctly with Hvplot.
I tried using both the Rasterio CRS and converting to a Cartopy CRS, but hvplot is unhappy with both of them.
This is a reproducible example:
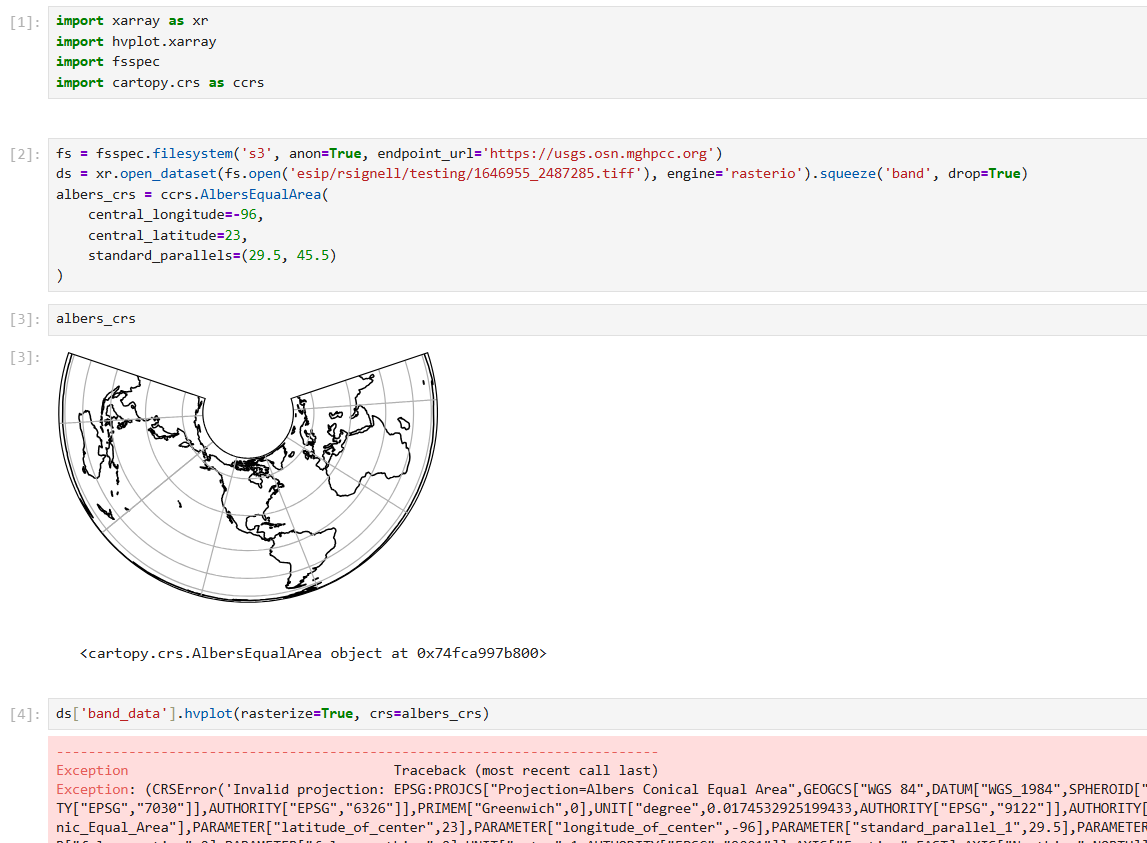
import xarray as xr
import hvplot.xarray
import fsspec

fs = fsspec.filesystem('s3', anon=True, endpoint_url='https://usgs.osn.mghpcc.org')
ds = xr.open_dataset(fs.open('esip/rsignell/testing/1646955_2487285.tiff'), engine='rasterio').squeeze('band', drop=True)
rasterio_crs = ds['band_data'].rio.crs
ds['band_data'].hvplot(rasterize=True, crs=rasterio_crs)
which fails with:
Exception: (CRSError('Invalid projection: ...
ValueError: Projection must be defined as a EPSG code, proj4 string, WKT string, cartopy CRS instance, cartopy CRS class name string, pyproj.Proj, or pyproj.CRS.
which was strange, because I was pretty sure that I’ve used a rasterio CRS before. But I went ahead and converted the Rasterio CRS to a Cartopy CRS using:
from pyproj.crs import CRS as PyprojCRS
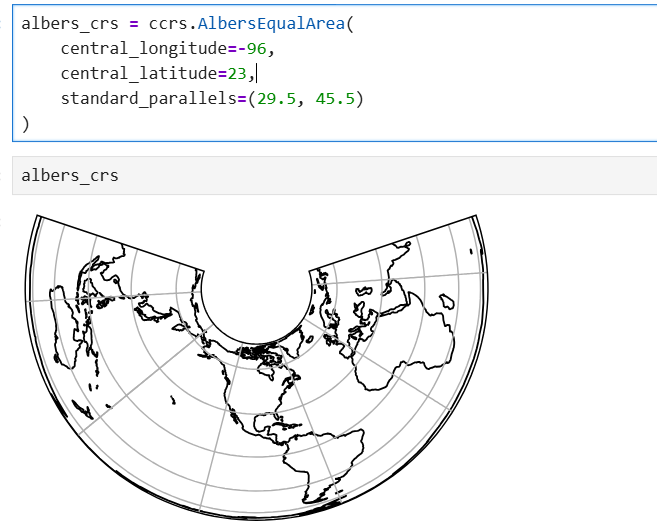
import cartopy.crs as ccrs
pyproj_crs = PyprojCRS.from_user_input(rasterio_crs)
cartopy_crs = ccrs.CRS(pyproj_crs.to_wkt())
but when I tried:
ds['band_data'].hvplot(rasterize=True, crs=cartopy_crs)
I got the same error:
ValueError: Projection must be defined as a EPSG code, proj4 string, WKT string, cartopy CRS instance, cartopy CRS class name string, pyproj.Proj, or pyproj.CRS.
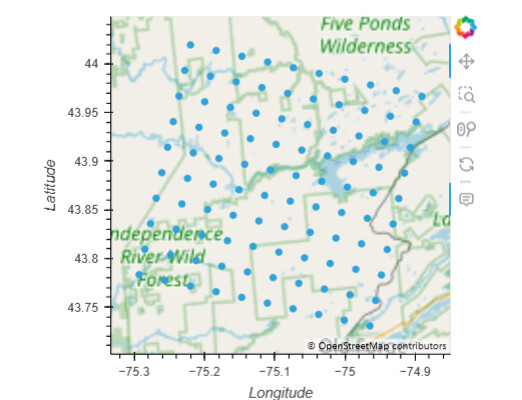
The problem doesn’t seem to be with rasterio, since if I use rasterio to reproject it works fine:
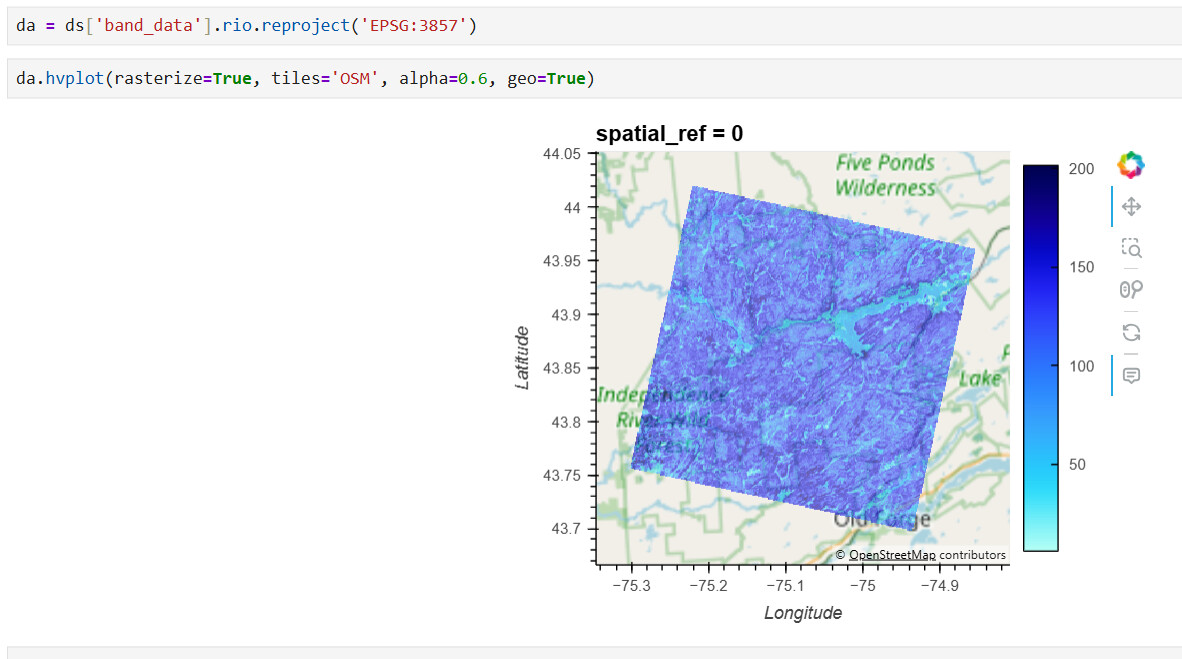
Using
da.hvplot(crs=...) should work, right?
What am I missing??
Full reproducible notebook is here.