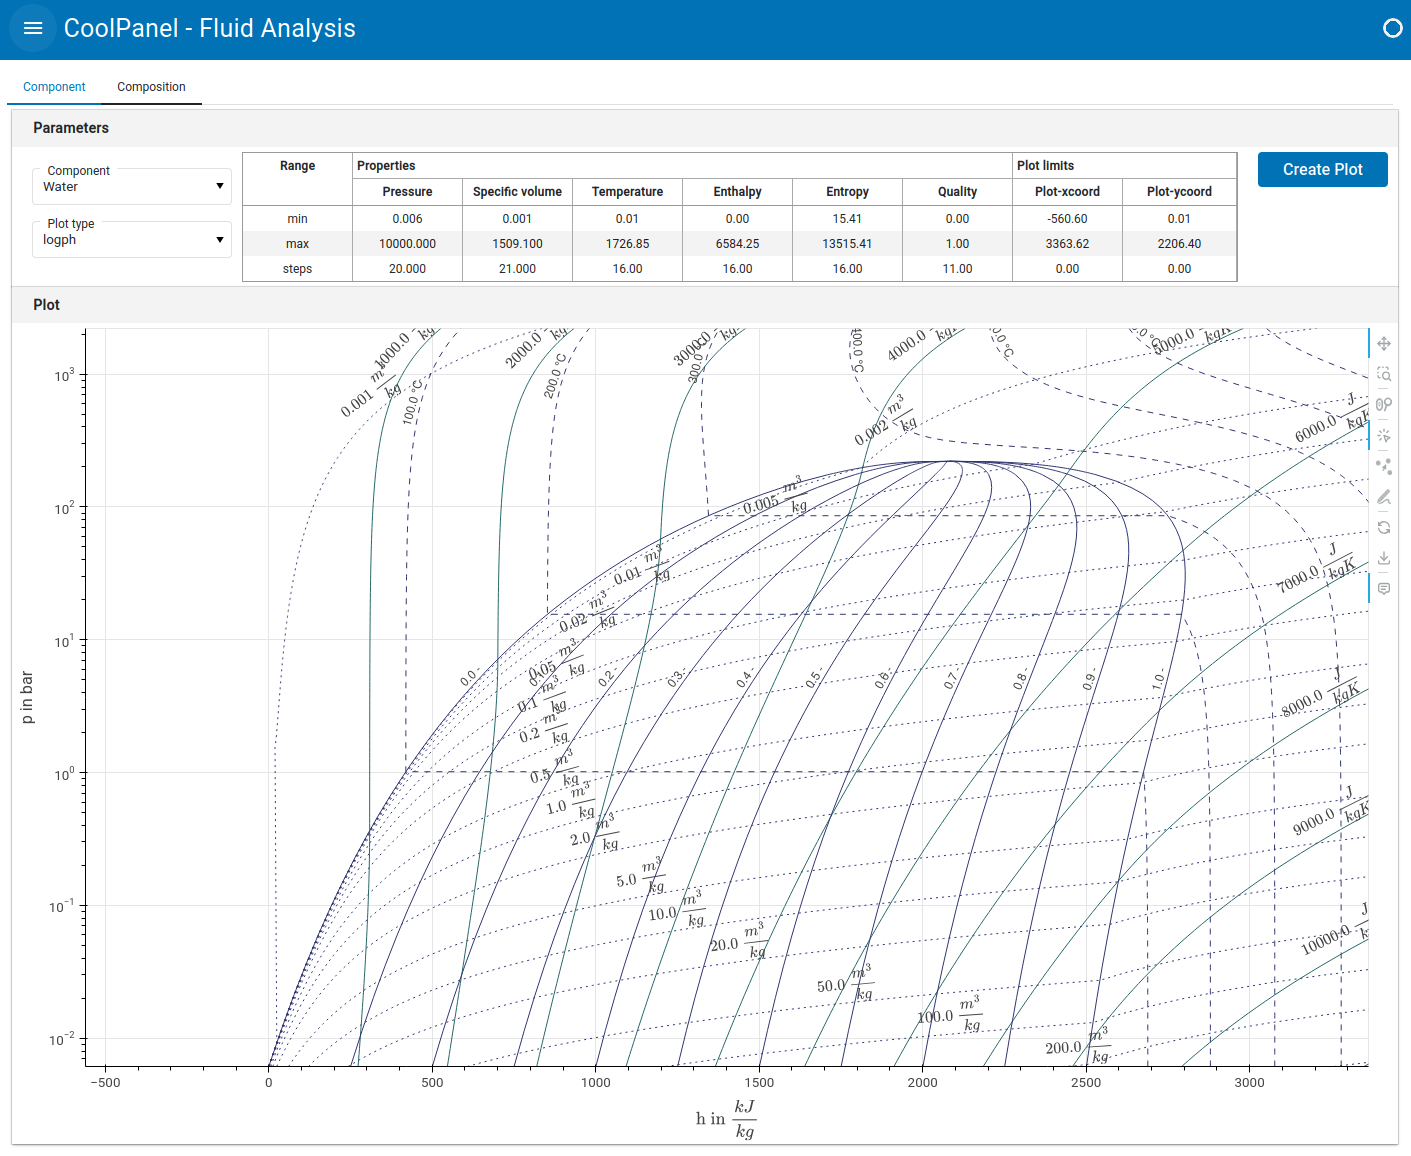
Here’s a small Panel web-app I’ve developed. It’s an app in the thermodynamics domain. It shows phase and thermodynamic property diagrams. Its has a powerful calculation engine under the bonnet called CoolProp (not written by me). For me it’s a first exercise in writing a web app/GUI using Panel. The idea is to bridge a gap between a C++ library that can only be used by experts, to a functional app that can be used by many. There are many brilliant open-source initiatives out there, and making some visible to end-users may help a bit getting some attention for some. Writing this UI in Panel was an excellent learning exercise. Have a look if you’re interested, and I’m open for useful comment, hints & pointers.
Yes, the plot quality is quite good. Happy with that! These isolines btw are calculated by the CoolProp engine behind this app. The isolines are then picked up as a list of points (x,y), which are plotted as lines in Bokeh. They are not calculated by Bokeh from a 2D map / data-slice (x, y, val) as such.
The original code has these lines plotted in Matplotlib. I started out with that, but found Bokeh more suitable and a bit more feature rich, with a few more options on the toolbar on the right of the plot. For some reason Matplotlib only showed half a plot. I posted a question about that here before but solved it by using Bokeh.
Well, the py.cafe demo doesn’t seem to be functioning anymore. Maybe it’ll get fixed at some point, but now for now it produces an asyncio error. I’ve put it here for those who want to have a demo: Fluid Analysis