Hello everyone,
I am unable to generate contour or 3D plots using holoviews.
I have data in point clout form or XYZ. Have written script to convert it into a mesh format. Unable to figure how to pass these to contour or 3D plots. Here is sample data I have generated in code below.
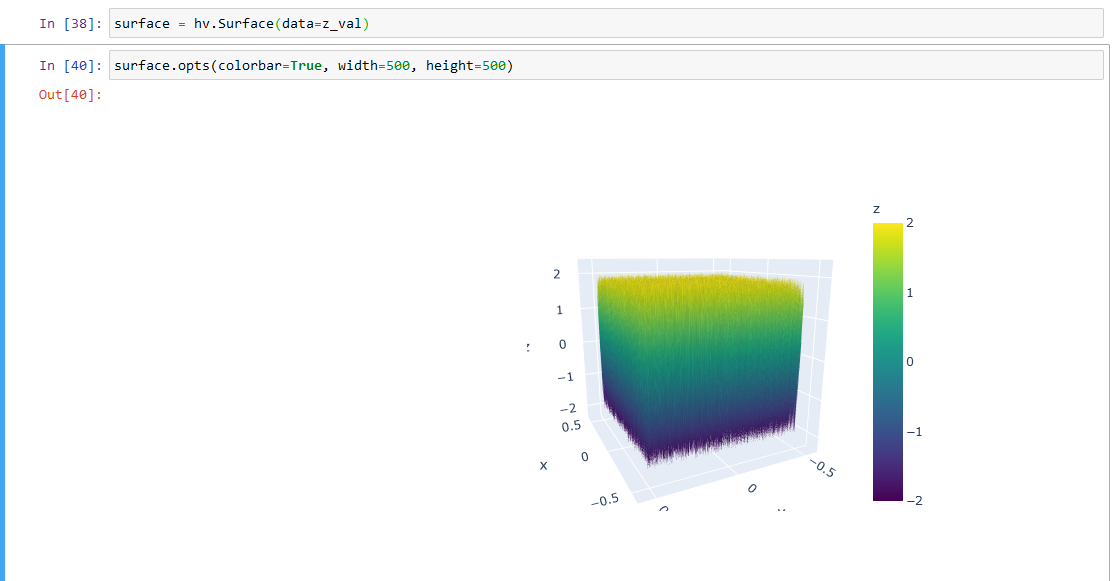
I am able to generate 3D plot using z_val only, but do not know how to pass x and y information. Any help or pointers appreciated. Thank you.
import numpy as np

x_val = np.linspace(-15.,15.,num=751,endpoint=True)
y_val = x_val
z_val = np.random.uniform(low=-2., high=2., size=(np.shape(x_val)[0],np.shape(y_val)[0]))
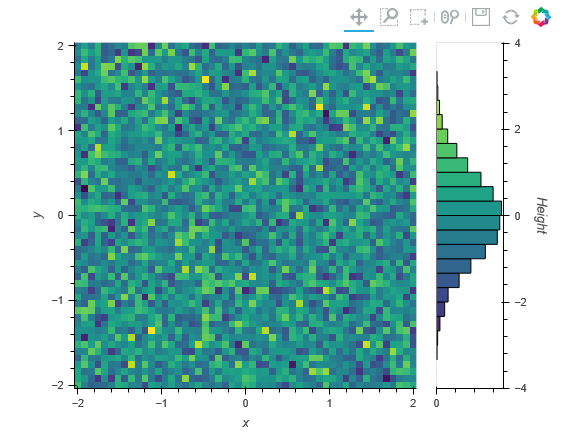
I reviewed the User Guide and found Gridded Datasets section which was useful in what I am trying to achieve. I have two XYZ point cloud data and interested in comparing two of them. Was thinking about using Contour or 3D plots, however the colormesh provided in the example works well for me.
Below is how I went about recreating it. I reduced the size of x and y values to make it easier for prototyping since the image was becoming very large.
import numpy as np
import holoviews as hv
from holoviews import opts
hv.extension(‘bokeh’, ‘matplotlib’)
x_value = np.linspace(start=-2., stop=2., num=51, endpoint=True)
y_value = x_value
z_grid = np.random.normal(loc=0.0, scale=1.0, size=(np.shape(x_value)[0], np.shape(y_value)[0]))
ds = hv.Dataset((x_value, y_value, z_grid),
[‘x’, ‘y’], ‘Height’)
type(ds.data), list(ds.data.keys())
ds.clone(datatype=[‘xarray’]).data
opts.defaults(
opts.GridSpace(shared_xaxis=True, shared_yaxis=True),
opts.Image(cmap=‘viridis’, width=400, height=400),
opts.Labels(text_color=‘white’, text_font_size=‘8pt’, text_align=‘left’, text_baseline=‘bottom’),
opts.Path(color=‘white’),
opts.Spread(width=600),
opts.Overlay(show_legend=False))
ds.to(hv.Image, [‘x’, ‘y’]).hist()
1 Like