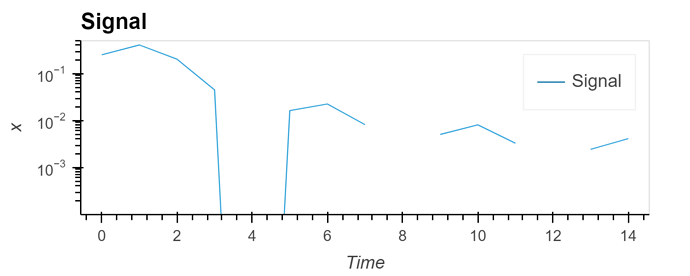
How would one fix this problem with hv.Curve not displaying segments that have one endpoint out of range:
A=np.array( [ 2.50500000e-01,  4.05920687e-01,  2.02641034e-01,  4.48187655e-02,
  1.86517468e-17,  1.63380441e-02,  2.25144853e-02,  8.17950836e-03,
 -3.99680289e-18,  5.07357941e-03,  8.10436139e-03,  3.29092520e-03,
 -8.77076189e-18,  2.44643183e-03,  4.13422525e-03]  )
hv.Curve(A).opts(width=500, height=200, logy=True, ylim=(1e-4,0.5))
My actual code is
def spikes(data, dims=["Time", "x"], label="Signal", add_curve=True):
    if isinstance(data, tuple):
        t,s=data
    else:
        t=np.arange(0,len(data), 1)
        s=data
    hs = hv.Spikes((t,s),*dims, label=label).opts(muted_alpha=0.)
    if add_curve: hs = hs * hv.Curve((t,s), label=label).opts(line_width=0.8)
    return hs
spikes(A, add_curve=True).opts("Curve", width=500, height=200, logy=True, ylim=(1e-4,0.5))\
                         .opts("Spikes", logy=True, ylim=(1e-4,0.5))
which points to yet another difficulty using hv.Spikes that I will have to fix in the spikes() function…
.
