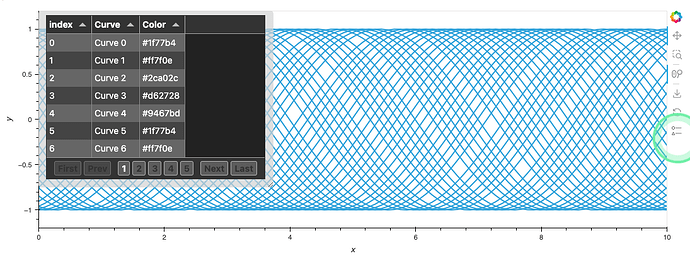
Here’s an example of creating a custom Bokek tool/toolbar icon. It is toggling the visibility on a tabulator table that is intentionally overlapping a plot
import numpy as np
import holoviews as hv
import panel as pn
import pandas as pd
from bokeh.models import Panel, Node, CustomJS, CustomAction
from bokeh.models.dom import HTML
from bokeh.plotting import show
import base64
from textwrap import dedent

hv.extension('bokeh')
pn.extension('tabulator')

xs = np.linspace(0, 10, 100)
curves = {f'Curve {i}': hv.Curve((xs, np.sin(xs + i))) for i in range(40)}
overlay = hv.Overlay(curves).opts(responsive=True, min_height=400)

legend_data = pd.DataFrame({
    'Curve': list(curves.keys()),
    'Color': ['#1f77b4', '#ff7f0e', '#2ca02c', '#d62728', '#9467bd']*8
})

legend_table = pn.widgets.Tabulator(legend_data, sizing_mode='stretch_height', theme="midnight", pagination='local', page_size=7)

attribution = Panel(
    position=Node(target="frame", symbol="top_left"),
    anchor="top_left",
    css_variables={
        "--max-width": Node(target="frame", symbol="width"),
    },
    stylesheets=["""
:host {
  padding: 2px;
  background-color: rgba(211, 211, 211, 0.7);
  font-size: 8px;
  border-radius: 5px;
  white-space: nowrap;
  overflow: hidden;
  text-overflow: ellipsis;
  min-width: 2%;
  min-height: 2%;
  max-height: 85%;
}
"""],
    elements=[
        HTML(legend_table.get_root()),
    ],
    styles={"resize": "both", "overflow": "hidden"}
)

legend_icon = """
<svg width="100" height="100" viewBox="0 0 100 100" xmlns="http://www.w3.org/2000/svg">
  <!-- Circle and Line -->
  <circle cx="15" cy="20" r="12" stroke="black" stroke-width="3" fill="none"/>
  <line x1="35" y1="20" x2="90" y2="20" stroke="black" stroke-width="3"/>

  <!-- Triangle and Line -->
  <polygon points="15,60 27,84 3,84" stroke="black" stroke-width="3" fill="none"/>
  <line x1="35" y1="70" x2="90" y2="70" stroke="black" stroke-width="3"/>
</svg>

"""

encoded_icon = base64.b64encode(dedent(legend_icon).encode()).decode('ascii')

def add_legend_to_plot(plot, element):
    figure = plot.handles["plot"]
    figure.elements.append(attribution)

def add_legend_toolbar_icon(plot, element):
    figure = plot.handles["plot"]
    legend_tool = CustomAction(
        icon=f"data:image/svg+xml;base64,{encoded_icon}",
        description="Toggle Legend",
        callback=CustomJS(
            args={"attribution": attribution},
            code="""
            export default ({attribution}) => {
                attribution.visible = !attribution.visible;
            }""",
        )
    )
    figure.toolbar.tools.append(legend_tool)

overlay.opts(hooks=[add_legend_to_plot, add_legend_toolbar_icon])

overlay