Just wanted to share this too for MPL
import holoviews as hv
import pandas as pd
import matplotlib as mpl
df = pd.DataFrame(
{
"x": range(1, 9),
"y": [1] * 8,
"z": range(1, 9),
}
)
hv.extension("matplotlib")
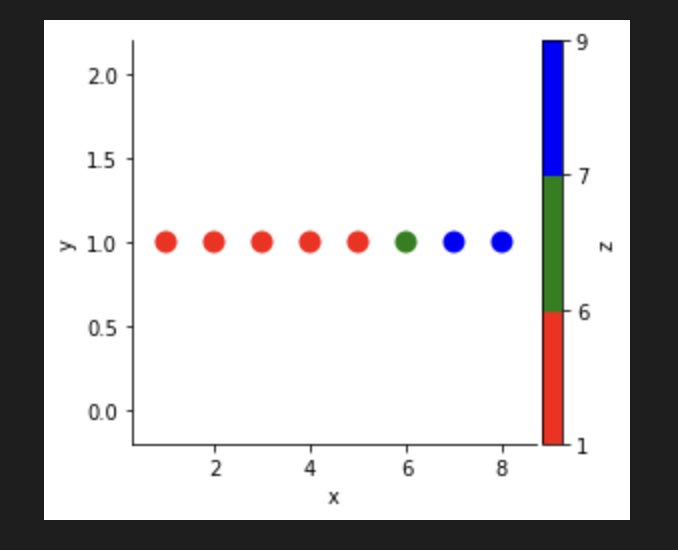
bounds = [1, 6, 7, 9]
cmap = mpl.colors.ListedColormap(["red", "green", "blue"])
norm = mpl.colors.BoundaryNorm(bounds, cmap.N)
hv.Scatter(
df,
kdims=["x", "y"],
vdims=["z"],
).opts(
colorbar=True,
cmap=["red", "green", "blue"],
norm=norm,
colorbar_opts={
"ticks": bounds,
"fraction": 0.6,
},
s=120,
c="z",
)