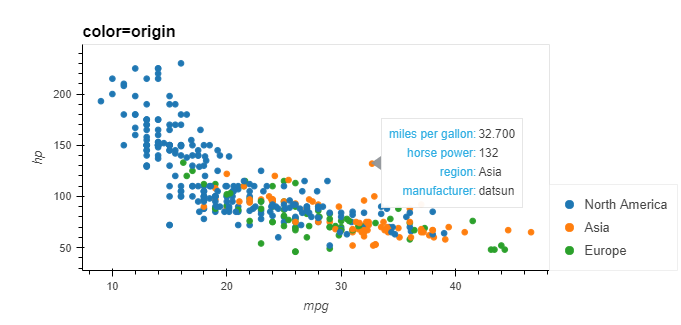
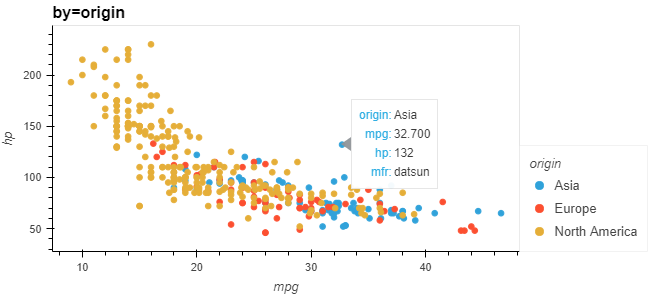
I’m new to HoloViz and just started using the bokeh HoverTool to customise how the hover tool looks. I noticed that when I use “by=‘category_column’” rather than “color=‘category_column’” the custom hover tool formatting is overridden.
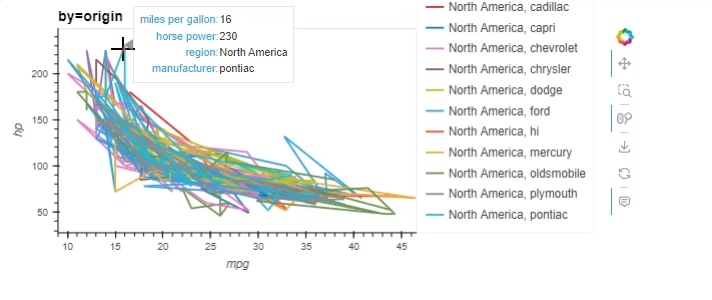
I produced a simple example with scatter plots below to illustrate the issue. Obviously for a scatter plot I could just use “color=‘category_column’” to get around this problem but for line plots you can only use “by=‘category_column’” as far as I know.
import hvplot.pandas
import holoviews as hv
from bokeh.sampledata.autompg import autompg_clean as df
from bokeh.models import HoverTool
hv.extension(“bokeh”)
hover = HoverTool(
tooltips=[(‘miles per gallon’,‘@mpg’),
(‘horse power’,‘@hp’),
(‘region’, ‘@origin’),
(‘manufacturer’, ‘@mfr’)
]
)
df.hvplot(
x=‘mpg’,
y=‘hp’,
kind=‘scatter’,
color=‘origin’, # HoverTool works fine
title=‘color=origin’,
# by=‘origin’, # HoverTool doesn’t work
# title=‘by=origin’,
hover_cols=[‘origin’, ‘mfr’],
).opts(
tools=[hover],
)