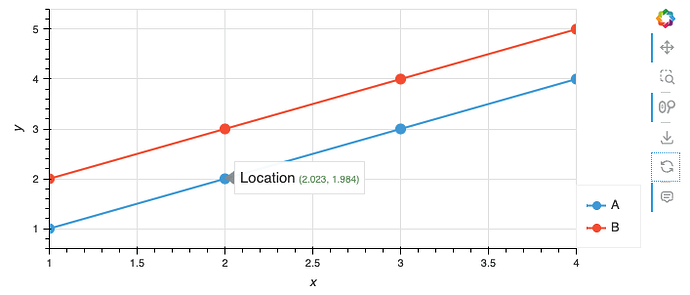
I’m trying to use a custom hover with a basic line + scatter plot. This is with the aim of displaying an image.
The data is grouped so I plot using by.
For example:
import pandas as pd

import holoviews as hv
import hvplot.pandas
from bokeh.models import HoverTool

df = pd.DataFrame(
    {
        "x": [1, 2, 3, 4, 1, 2, 3, 4],
        "y": [1, 2, 3, 4, 2, 3, 4, 5],
        "group": ["A", "A", "A", "A", "B", "B", "B", "B"],
        "image": ["path", "path", "path", "path", "path", "path", "path", "path"]
    }
)

line = df.hvplot(
            x="x",
            y="y",
            by="group",
            grid=True,
            hover=False,
            legend=True,
        )

points = df.hvplot(
            x="x",
            y="y",
            by="group",
            grid=True,
            kind="scatter",
            size=100,
            marker="circle",
            hover_cols=[
                "image",
            ],
        )

line * points
With no custom hover this plots fine and the hover works on both groups.
Now if I use a custom HTML hover tool:
hover = HoverTool(tooltips = """
    <div>
        <div>
            <span style="font-size: 15px;">Location</span>
            <span style="font-size: 10px; color: #696;">($x, $y)</span>
        </div>
    </div>
""")

line = df.hvplot(
            x="x",
            y="y",
            by="group",
            grid=True,
            hover=False,
            legend=True,
        )

points = df.hvplot(
            x="x",
            y="y",
            by="group",
            grid=True,
            kind="scatter",
            size=100,
            marker="circle",
            hover_cols=[
                "image",
            ],
            tools=[hover]
        )

line * points
The hover works on the first series:
But nothing displays on the second series.
Am I missing something here? Is there a way to force the custom hover on to all series?
Thanks in advance for any help.
Versions:
bokeh-3.7.3 holoviews-1.21.0 hvplot-0.11.3 panel-1.7.4


