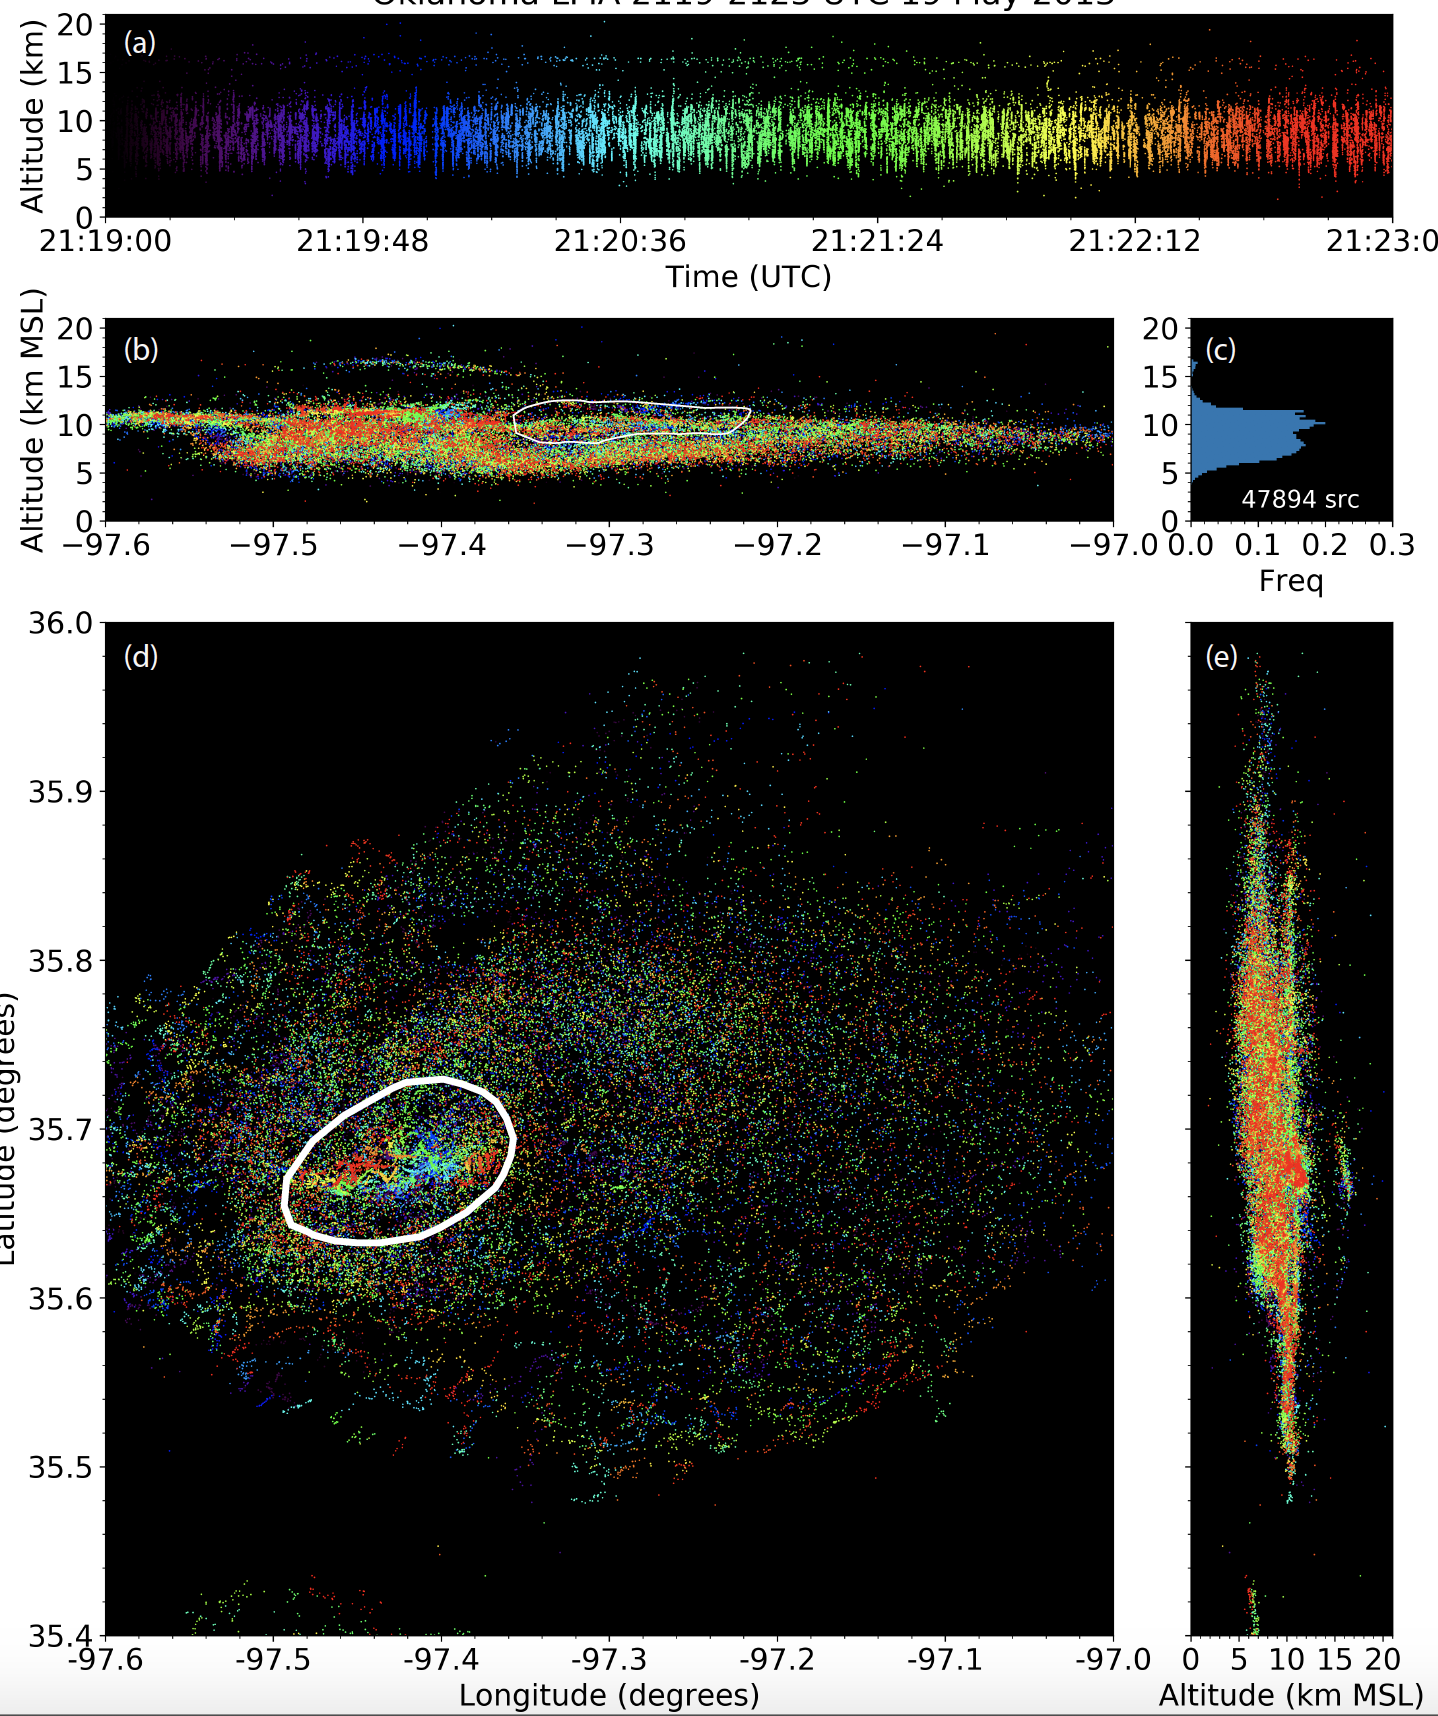
Hi, I want to create a layout with 3 rows and 2 columns and the subplot at location (3,2) being transposed (see attached sample plot below). You can ignore the subplot at location (2,2) for now.
All the subplots should be synced so that mouse scroll in one subplot zooms in/out in other subplots too. I could not find an easy solution to it although I did notice many folks asking for similar functionality.
What’s the easiest way to create such a custom layout in holoviews while using datashader functionality?
Here’s my code but it want to customize it by having only subplot in row1 covering two columns
import colorcet as cc
ltg_data = lma.get_active() # returns a copy of the data, as a Pandas Dataframe
ltg_data = ltg_data[(ltg_data['alt'] <=20)]
points1 = hv.Points(ltg_data,kdims=['lon','alt'])
datashaded1 = hd.datashade(points1,cmap=cc.fire).redim.range(y=(0,20),x=(-87.6,-86.8))
plot1 = hd.dynspread(datashaded1, threshold=0.10, how='over').opts(height=300,width=600)
points2 = hv.Points(ltg_data,kdims=['lat','alt'])
datashaded2 = hd.datashade(points2,cmap=cc.fire).redim.range(y=(0,20),x=(-34,34.4))
plot2 = hd.dynspread(datashaded2, threshold=0.10, how='over').opts(height=300,width=600)
points3 = hv.Points(ltg_data,kdims=['time','alt'])
datashaded3 = hd.datashade(points3,cmap=cc.fire).redim.range(y=(0,20))
plot3 = hd.dynspread(datashaded3, threshold=0.10, how='over').opts(height=300,width=600)
points4 = hv.Points(ltg_data,kdims=['lon','lat'])
datashaded4 = hd.datashade(points4,cmap=cc.fire).redim.range(y=(-34,34.4),x=(-87.6,-86.8))
plot4 = hd.dynspread(datashaded4, threshold=0.10, how='over').opts(height=3 00,width=600)
hv.Layout([plot1,plot2,plot3,plot4]).cols(2)