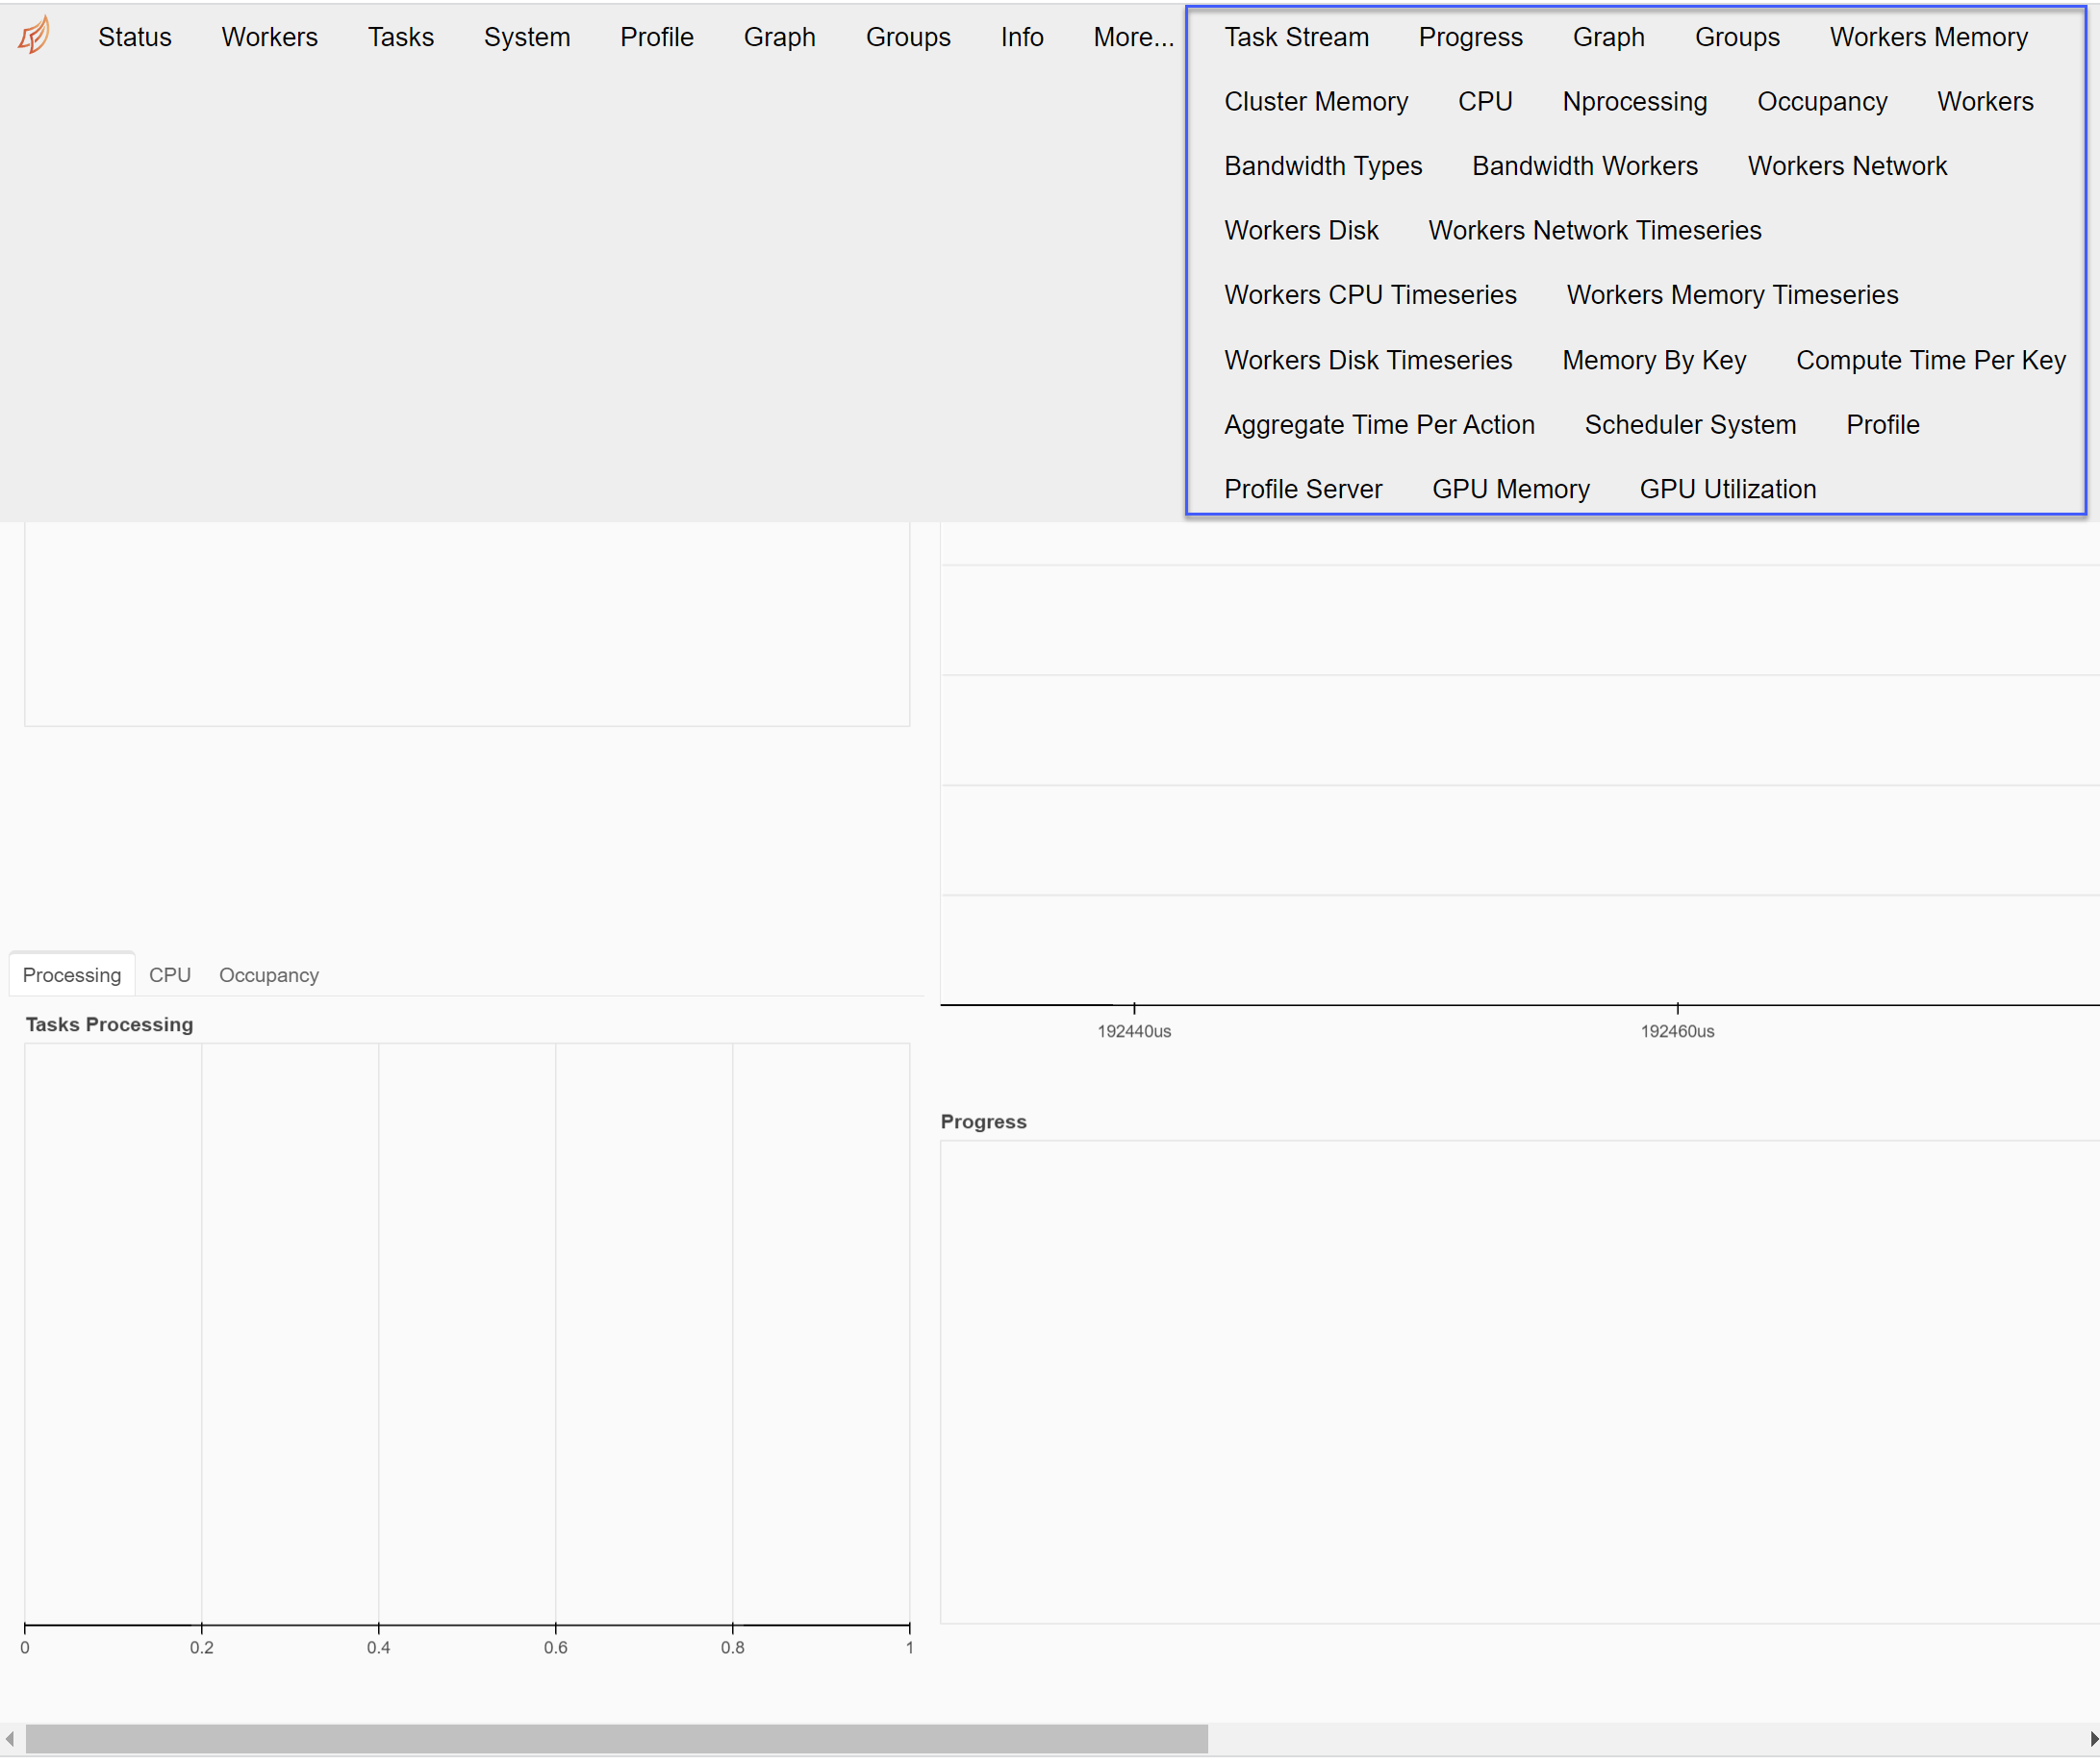
I notice that the default content in the dashboard header is pretty extensive and in some cases takes up too much space. Is there any way to limit the items in the header or set expand to False or similar? Earlier versions 2021.6.0 did have less info in the dashboard. The difference in headers is indicated by the blue square in the image below and seems to have been changed between these two mentioned versions.
Also to see see the dashboard I need to do it differently between the two versions:
In 2021.06.0 I call the dashboard just calling the client as below:
from distributed import Client
client = Client()
# call client to see the dashboard
client
In 2021.10.0 I call the dashboard as below:
from distributed import Client
client = Client()
# call client.scheduler_info() to see the dashboard
client.scheduler_info()
# or
client
Did you mean to ask that on this discourse? While we are users of dask and interact with Dask developers frequently this Discourse is focused on HoloViz projects.
I’d like to think that the subtext of this post is “Dask’s Bokeh-based dashboard is amazing, and I see that you guys are friendly with Dask and are also using Bokeh to do great things, so surely you had a hand in that and maybe Dask’s dashboard is actually a hierarchical HoloViews or Panel object that I could unpack and repack as I wish”?
Alas, no; Dask’s dashboard is written directly in Bokeh and isn’t just a collection of self-contained HoloViews or Panel objects that can easily be mixed and matched. I personally wish that it were that way, as I often want to grab one of those panes and display it in a notebook cell or as part of a dashboard, but it was all written independently of HoloViz. It still may be possible to get bits of it and use Panel to display them in a different way, but that’s not as trivial as it would be for a Panel or HoloViews layout.
Thank you for the feedback! Yes, the dashboard is really amazing and useful. I am getting good insight into performance of datashader using this dashboard. Agree it would be convenient if the charts were holoviews or panel objects. But probably there is some way to constrain the list of headers in the output. I have flagged my initial message to not show up in holoviz now. Not sure how you would like the thread to be deleted or not. Thanks for all good efforts you do.
Presumably you mean mixing and matching in Panel; HoloViews layouts can only handle HoloViews objects. And so you can’t select e.g. a range of a plot or sample it the way you could in HoloViews. In any case, would be nice to show an example of making a custom collection of some of the bits of the Dask dashboard as a Panel layout!
@jbednar@geoviz@philippjfr@Marc I wanted to use some of the components from the dask dashboard, so I took a stab at it and I have a working example.
Most of them use period callbacks and you can see where each figure is build in dask.distributed.dashboard.scheduler (that is one of the dashboard launching files, so you can see all of the imports there) as of Dask version 2022.12.1.
Here is an example to launch there SystemMonitor app
import panel as pn
from tornado.ioloop import IOLoop

from dask.distributed import LocalCluster
from distributed.dashboard.components.shared import SystemMonitor


def get_app(scheduler):
    # we use a closure to avoid global variables
    def inner():
        comp = SystemMonitor(scheduler, sizing_mode="stretch_both")
        # Add a periodic callback to update the figure, most (all?) of Dask's components have an update method
        pn.state.add_periodic_callback(comp.update, 500)
        return pn.pane.Bokeh(comp.root)
    return inner


if __name__ == '__main__':
    loop=IOLoop().current()  # grab the IOLoop before LocalCluster is initialized, otherwise you grab the wrong one

    cluster = LocalCluster(dashboard_address=None)
    # the scheduler is what we really need, but it is more difficult to initialize on its own, so this is easier
    # as a proof of concept, but you should be able to do it with a scheduler by itself. Probably
    scheduler = cluster.scheduler

    server = pn.serve(get_app(scheduler), port=5006, loop=loop)
That’s really cool! I have definitely wanted to be able to pick and choose bits of the Dask visualizations and put them in an app (now seemingly clear!) or use them in a notebook (still less clear to me). Thanks!
 Our apps and dashboards are even more interesting.
 .
.