Dataset to Polygons with Groupby + Legend

I have a dataframe that contains sets of coordinates and categories. Sets of coordinates represent polygons, and each polygon has an ID to identify it and some category. When trying to use a hv.Dataset to produce the polygons, grouping on the ID, and coloring by the category (along with a custom cmap), I get the following error:

Only one of legend, legend_label, legend_field or legend_group may be provided, got: legend_label or legend_field

Example

import holoviews as hv
import pandas as pd

hv.extension('bokeh')

df = pd.DataFrame({
    'x': [0, 1, 1, 1, 2, 2, 2, 3, 3],
    'y': [0, 0, 1, 0, 0, 1, 0, 0, 1],
    'id':['foo', 'foo', 'foo', 'bar', 'bar', 'bar', 'baz', 'baz', 'baz'],
    'type':['a', 'a', 'a', 'b', 'b', 'b', 'a', 'a', 'a']
})
hv.Dataset(df, kdims=['x', 'y']).to(hv.Polygons, groupby='id').overlay().opts(
    hv.opts.Polygons(color='type', cmap={'a':'red', 'b':'blue'}, show_legend=True)
)

This particular example should produce a red, a blue, and another red triangle, and the legend should show that a is red and b is blue. Is there a better way to achieve this to begin with?
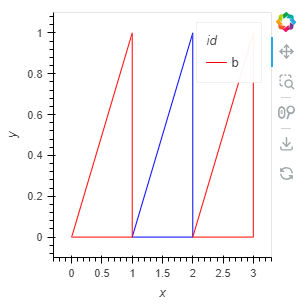
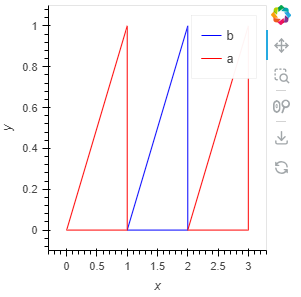
I can artificially pad each polygon with the first point to “close” the loop and then use hv.Path, but the legend is messed up (missing entry for a, and b should be blue, not red).

import holoviews as hv
import pandas as pd

hv.extension('bokeh')

df = pd.DataFrame({
    'x': [0, 1, 1, 0, 1, 2, 2, 1, 2, 3, 3, 2],
    'y': [0, 0, 1, 0, 0, 0, 1, 0, 0, 0, 1, 0],
    'id':['foo', 'foo', 'foo', 'foo', 'bar', 'bar', 'bar', 'bar', 'baz', 'baz', 'baz', 'baz'],
    'type':['a', 'a', 'a', 'a', 'b', 'b', 'b', 'b', 'a', 'a', 'a', 'a']
})
hv.Dataset(df, kdims=['x', 'y']).to(hv.Path, groupby='id').overlay().opts(
    hv.opts.Path(color='type', cmap={'a':'red', 'b':'blue'}, show_legend=True)
)

image

This works if I manually construct the overlay:

cmap = {'a':'red', 'b':'blue'}
hv.Overlay([
    hv.Path(gdf, label=gdf.iloc[0]['type']).opts(color=cmap[gdf.iloc[0]['type']], show_legend=True)
    for (_, gdf) in df.groupby('id')
])

image

I feel like a better way must exist.

This could be a bug; can you raise an issue on GitHub?

1 Like

I have a workaround for now, but would love if I could produce the desired plots directly from the hv.Dataset.