Datashade object not resizing to fit window

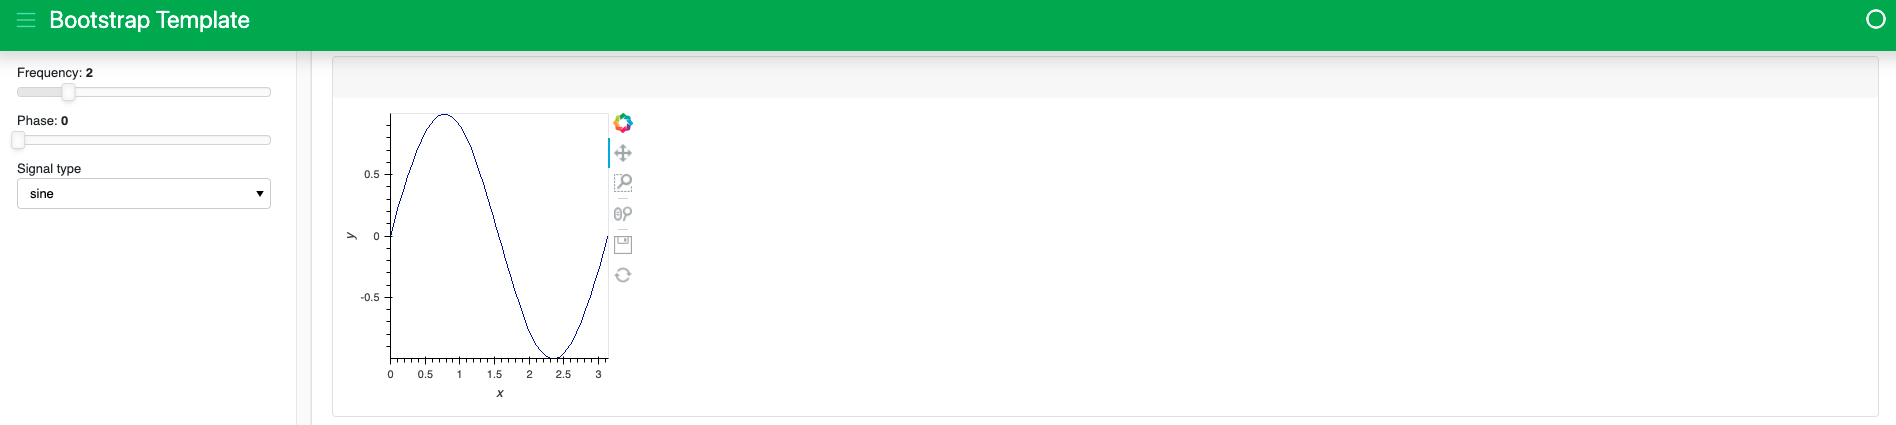
I have been having to use a set width and height for datashade objects because when putting objects into panel the graph sizes do not change with the window size. This is only the case for datashade as holoview works with no issues.

panel version - 0.10.2
holoviews version - 1.13.5

Example code

bootstrap = pn.template.BootstrapTemplate(title = 'Bootstrap Template')

pn.config.sizing_mode = 'stretch_width'

xs = np.linspace(0, np.pi)
freq = pn.widgets.FloatSlider(name = "Frequency", start = 0, end = 10, value = 2)
phase = pn.widgets.FloatSlider(name = "Phase", start = 0, end = np.pi)
signal = pn.widgets.Select(name = "Signal type", value='sine', options= ['sine','cosine'])

sidebar = pn.Column(freq, phase, signal)

@pn.depends(freq=freq, phase=phase, signal = signal)
def waves(freq, phase, signal):
    if signal == 'sine':
        hv_plot = hv.Curve((xs, np.sin(xs*freq + phase)), ).opts(responsive = True, min_height = 400)
        hv_plot = datashade(hv_plot)
    else:
        hv_plot = hv.Curve((xs, np.cos(xs*freq + phase))).opts(responsive = True, min_height = 400)
        hv_plot = datashade(hv_plot)
    
    return hv_plot

bootstrap.sidebar.append(sidebar)

bootstrap.main.append(
    pn.Row(
        pn.Card(waves)
    )
)

bootstrap.show()

Hi @tommy-stone,

Apologies if I’m misunderstanding here, I think you want the datashaded graph to be responsive? My understanding is when you apply the datashade transfer function some of the options you set at the holoviews level get lost so you have to give the datashader function options also and then your good.

I wasn’t quite sure of the imports so I’ve thrown together a bunch and modified the code slightly example below

import panel as pn
import numpy as np
import holoviews as hv
import datashader as ds

import holoviews.operation.datashader as hd

from panel.template import DarkTheme
pn.extension('perspective')
hv.extension('bokeh', 'matplotlib')
bootstrap = pn.template.BootstrapTemplate(title = 'Bootstrap Template')

pn.config.sizing_mode = 'stretch_width'

xs = np.linspace(0, np.pi)
freq = pn.widgets.FloatSlider(name = "Frequency", start = 0, end = 10, value = 2)
phase = pn.widgets.FloatSlider(name = "Phase", start = 0, end = np.pi)
signal = pn.widgets.Select(name = "Signal type", value='sine', options= ['sine','cosine'])

sidebar = pn.Column(freq, phase, signal)

@pn.depends(freq=freq, phase=phase, signal = signal)
def waves(freq, phase, signal):
    if signal == 'sine':
        hv_plot = hv.Curve((xs, np.sin(xs*freq + phase)), ).opts(responsive = True, min_height = 400)
        
        hv_plot = hd.datashade(hv_plot).opts(height=400, responsive=True)
    else:
        hv_plot = hv.Curve((xs, np.cos(xs*freq + phase))).opts(responsive = True, min_height = 400)
        
        hv_plot = hd.datashade(hv_plot).opts(height=400, responsive=True)
    
    return hv_plot

bootstrap.sidebar.append(sidebar)

bootstrap.main.append(
    pn.Row(
        pn.Card(waves)
    )
)

bootstrap.show()

1 Like

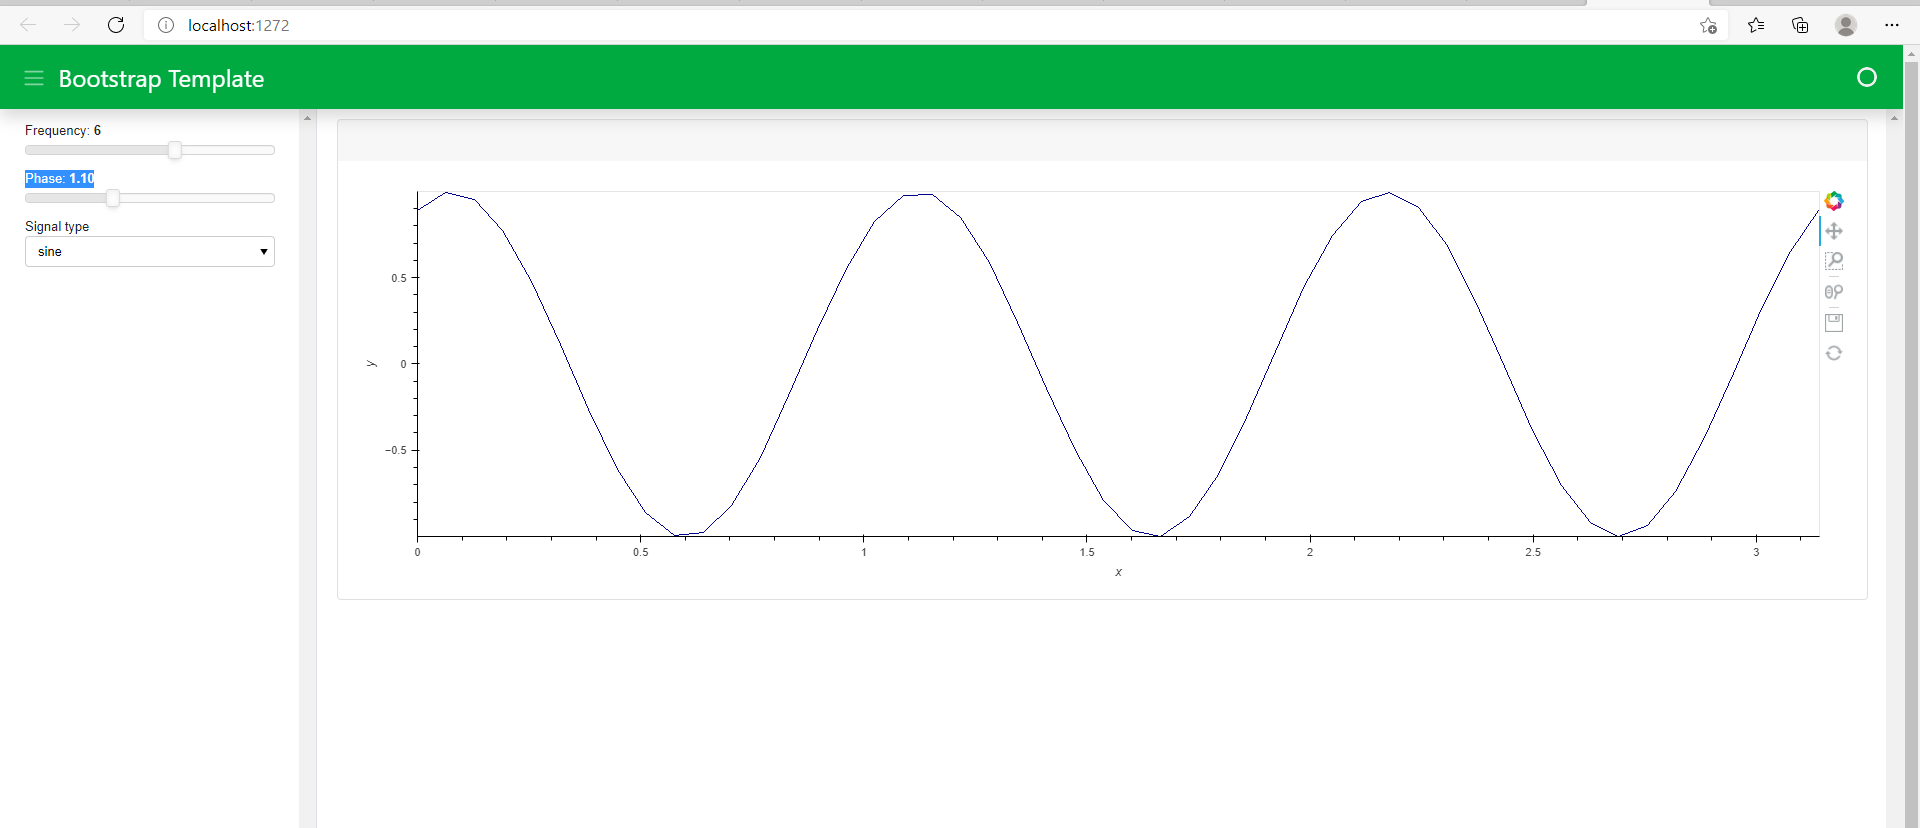
@carl Thank you! Adding the responsive flag to both the holview graph and datashader worked. I often have trouble finding all the arguments that can be used with opts. By chance do you know where this might be documented?

import holoviews as hv
from holoviews.operation.datashader import  datashade

hv.help(datashade)

I think you can type in hv.help(datashade) into a cell and run funnily enough responsive isn’t in there I probably picked it up along the way somewhere. The options having to be applied to datashade usually catches myself out probably because I’m not using it right myself.

2 Likes