Datashader + Bokeh without (!) HoloViews

Hello! I have decent experience building complex bokeh apps and recently ran across datashader. I need to build an interactive dashboard visualizing millions of points, great use case for datashader.

As I diving into the documentation and examples, I notice that every single one showcases holoviews. At the same time, the figure on this page illustrates that it is possible to build datashader+bokeh “big data” workflows without holoviews. Is that correct? Curious why I cannot find any other references on that.

Don’t get me wrong, holoviews looks awesome but I am about to start work on a fairly complex bokeh app and I am not sure if holoviews’ high-level implementation of bokeh is what I need, since I’ll need to customize many interactions. There’s an example here on the holoviews docs on how to deploy bokeh apps which is useful, but again, I am not sure if all this is necessary if I can just work with datashader and bokeh only.

Any thoughts/leads/examples would be greatly appreciated. Thank you!

1 Like

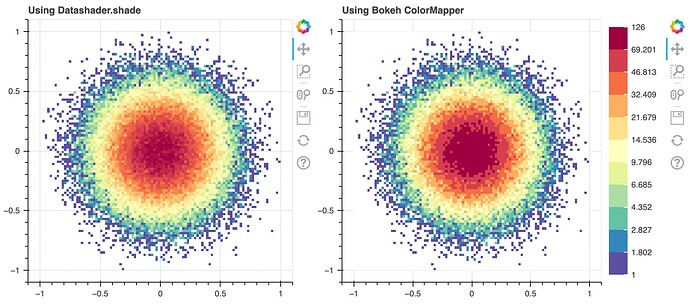
Yes you can. You can either use Datashader’s shade function to create an RGBA image and pass this to Bokeh’s figure.image_rgba, or you can pass the result of Datashader’s canvas.points call (or equivalent) to Bokeh’s figure.image and use an EqHistColorMapper (or Linear or Log color mapper) to do the shading in Bokeh. The latter allows you to easily add a colorbar.

Example output:

Code to generate this:

from bokeh.models import ColorBar, EqHistColorMapper
from bokeh.palettes import Spectral11
from bokeh.plotting import figure, row, show
import datashader as ds
import numpy as np
import pandas as pd

npoints = 100000
rng = np.random.default_rng(942852)
df = pd.DataFrame(dict(x=rng.normal(scale=0.25, size=npoints),
                       y=rng.normal(scale=0.25, size=npoints)))

canvas = ds.Canvas(100, 100, x_range=(-1, 1), y_range=(-1, 1))
agg = canvas.points(df, x="x", y="y")
im = ds.transfer_functions.shade(agg, cmap=list(Spectral11))

p0 = figure(width=420, height=400, title="Using Datashader.shade")
p0.image_rgba(image=[im.to_numpy()], x=-1, y=-1, dw=2, dh=2)

# Replace count of 0 with NaN so not rendered using color mapper.
agg = agg.to_numpy().astype(np.float64)
agg[agg==0.0] = np.nan

p1 = figure(width=500, height=400, title="Using Bokeh ColorMapper")
color_mapper = EqHistColorMapper(palette=Spectral11, nan_color="white")
p1.image(image=[agg], x=-1, y=-1, dw=2, dh=2, color_mapper=color_mapper)
color_bar = ColorBar(color_mapper=color_mapper)
p1.add_layout(color_bar, "right")

show(row(p0, p1))

The images look slightly different; there are changes in Bokeh 3.0 (due out very soon) that make Bokeh’s eq_hist colormapping more closely match Datashader’s. You cannot currently do categorical shading in Bokeh but there is work in progress (Categorical colormapping of 3D arrays by ianthomas23 · Pull Request #12356 · bokeh/bokeh · GitHub) to add this in the next few months.

Disadvantages of this approach are that the displayed resolution of the images is not the same as that produced by Datashader unless you manually twiddle it to account for Bokeh’s axis labels, etc. Also, when you zoom in you are just zooming into a static image. If these become important to you then should just use Holoviews; it is possible to implement resolution matching and zooming using Bokeh callbacks but then you are essentially writing your own version of Holoviews which is probably not a good use of time.
3 Likes

Got it. Thank you, @ianthomas23! As you mentioned, eliminating Holoviews would essentially require me building a Holoviews alternative to get the features I need, which would be counter productive.

Thank you for spending the time to respond, really appreciate it.

Thanks, @ianthomas23 ; those are all good points.

I can give a bit of the history that might help the situation be clearer. The initial implementation of Datashader interactivity used Bokeh alone, without HoloViews, and we attempted to maintain that implementation for a number of years (all visible in the Datashader repository file bokeh_ext.py if you look back far enough). What we found, though, is that because of the dynamic event triggering required to update on zoom and pan, we had to re-implement the interactive Datashader support for every single different Bokeh app or dashboard we wanted to write, so that all the right callbacks were set up and the right events were handled. That was doable for a single app, but did not let us provide dynamic Datashader plotting across different apps.

HoloViews encapsulates data objects at a higher level that allows you to mix and match, overlay, or embed them while keeping all the callbacks and events intact, which lets us implement those callbacks and events once, in HoloViews, and letting users then design their figures, apps, and dashboards however they like. In practice we’ve found that this approach is the only viable way that we can support Datashader in Bokeh, even when people need to customize the interactions. The full underlying Bokeh figure is always available from a HoloViews object, and so even if HoloViews doesn’t already handle the custom interactions (which often it does), using HoloViews shouldn’t prevent adding additional interactivity.

As for the figure at Interactivity — Datashader v0.14.3, yes, we do need to update it to show not just that we do not support Datashader + Bokeh directly any more, we do support Datashader + Matplotlib directly now! The Matplotlib support is only a limited subset of what HoloViews can do, but the architecture of Matplotlib does make it easier to encapsulate that interactivity in a way that we can support. I’ve opened an issue about that: Update interactivity figure for bokeh and matplotlib changes · Issue #1161 · holoviz/datashader · GitHub