I am using datashader to display a small subset of a much larger image in an interactive animation. However, the datashader update is quite slow and falls behind the play sequence.
Is there some way I can improve the performance in this?
Some key features I was looking for, but didn’t find:
- When running behind, it appears it tries to get each update in order instead of skipping ones that are not relevant any more
- Is there some kind of “buffering feature”, where we could ask datashader to buffer outside the visible range (and combined with skipping blocks when running behind this could potentially work ok)?
The closest I saw in my searching was a open issue: https://github.com/holoviz/holoviews/issues/4435
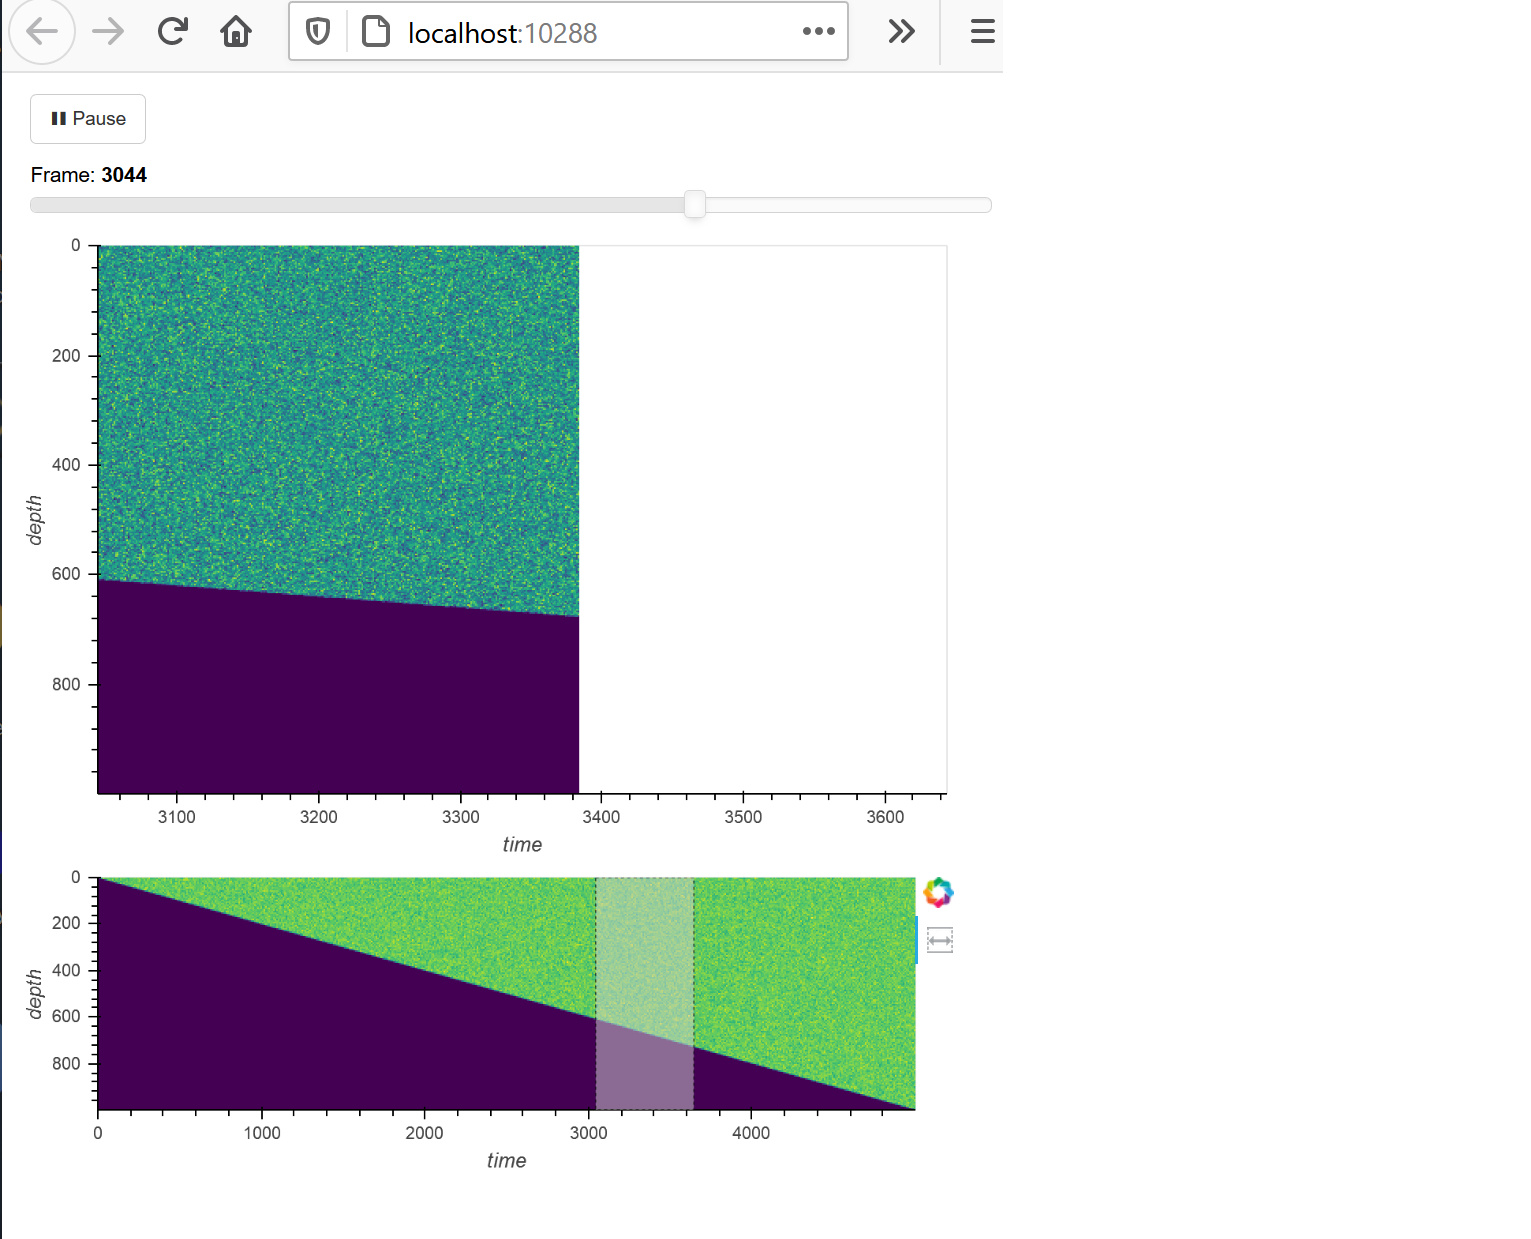
I have pasted a standalone example of the code below. If you press play, you will see the visible image shown get smaller over time as you can see in the attached image.
import sys
import xarray
import numpy
import holoviews
import holoviews.operation.datashader
import holoviews.plotting.links
import datashader.colors
import panel.widgets
import bokeh.resources
import random

# Configure the default renderer
holoviews.extension('bokeh')
renderer = holoviews.renderer('bokeh').instance(mode='server')


# Make up some random data for the image
DATA_POINTS = 5000
DEPTHS = 1000
time_arr = range (0, DATA_POINTS)
sonar_data_arr = numpy.zeros((DATA_POINTS, DEPTHS))
for i in range(0, DATA_POINTS):
	depth = i * DEPTHS / DATA_POINTS
	for j in range(0, int(depth)):
		sonar_data_arr[i][j] = random.randrange(255)
channel = xarray.Dataset({
		'amplitudes': (['time', 'depth'], sonar_data_arr, {'units': 'amplitude'}),
	},
	coords={
		'time': (['time'], time_arr),
		'depth': (['depth'], range(0,DEPTHS)),
	})


amplitudes = channel.amplitudes.transpose('depth', 'time')
sonar_image = holoviews.Image((channel.time, channel.depth, amplitudes), datatype=['grid'], kdims=['time', 'depth'], vdims=['amplitude'])


WIDTH = 600
HEIGHT = 400
KEY_HEIGHT = 200

INITIAL_XMIN = int(DATA_POINTS/2)
INITIAL_XMAX = INITIAL_XMIN + WIDTH

# Create a preview / selection image used to interactively select ranges to show in detail
preview = holoviews.operation.datashader.rasterize(sonar_image, width=WIDTH, height=KEY_HEIGHT, precompute=True)
preview = preview.opts(width=WIDTH, height=KEY_HEIGHT, cmap='viridis', logz=False, invert_yaxis=True)
preview = preview.opts(default_tools=[])
preview = preview.opts(axiswise=True)

# Tried just rasterizing and also datashading
detail = holoviews.operation.datashader.rasterize(sonar_image, width=WIDTH, height=KEY_HEIGHT, precompute=True)
detail = detail.opts(width=WIDTH, height=HEIGHT, cmap='viridis')
#detail = holoviews.operation.datashader.datashade(sonar_image, cmap=datashader.colors.viridis)
#detail = detail.opts(width=WIDTH, height=HEIGHT)
detail = detail.opts(xlim=(INITIAL_XMIN,INITIAL_XMAX))
detail = detail.opts(invert_yaxis=True)
detail = detail.opts(toolbar=None)

holoviews.plotting.links.RangeToolLink(preview, detail)


slider = panel.widgets.IntSlider(start=0, end=int(DATA_POINTS-(INITIAL_XMAX-INITIAL_XMIN)), value=INITIAL_XMIN, name="Frame")
slider.jscallback(value="""
detail.x_range.end = slider.value + (detail.x_range.end - detail.x_range.start);
detail.x_range.start = slider.value;
""", args={'detail': detail, 'slider': slider})

# From: https://panel.holoviz.org/user_guide/Links.html
button = panel.widgets.Button(name='► Play', width=60, align='start')
button.js_on_click(args={'button': button, 'slider': slider}, code='''
if (slider.play_timer) {
    clearInterval(slider.play_timer);
    slider.play_timer = null;
    button.label = "► Play";
}
else {
    slider.play_timer = setInterval(function(){
        slider.value = (slider.value + 1) % slider.end;
    }, 100)
    button.label = "❚❚ Pause";
}
''')

plot = panel.Column(
    panel.Row(
        panel.Column(button, slider, sizing_mode='scale_width'),
        sizing_mode='scale_width'),
    panel.Row(
        detail,
        sizing_mode='scale_width'),
    panel.Row(
        preview,
        sizing_mode='scale_both')

    , sizing_mode='scale_both')

#plot.save('plot.html', resources=bokeh.resources.INLINE)
plot.show()