I am creating a layout with multiple plots.
For each plot I define the “frame_width” to make sure that the plots have the same size, independent of the legend.
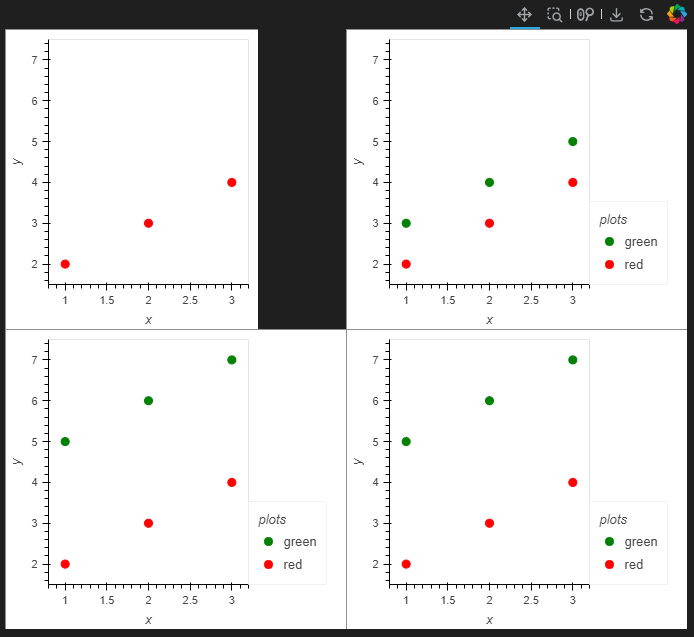
However, when a plot inside the layout doesn’t have a legend (or a smaller legend) there is a gap with a different color. (see picture below).
Can I set the background color of the complete layout?
I have tried to set a theme with a ‘background_fill_color’ and ‘border_fill_color’ for the “Figure” attribute, but this doesn’t seem to fix it.
Theme(json={‘attrs’ : {
‘Figure’ : {
‘background_fill_color’: ‘#2F2F2F’,
‘border_fill_color’: ‘#2F2F2F’,
}}})
df = pd.DataFrame({'x':  [1,2,3], 'y': [2,3,4],})
pa = hv.Scatter(df, kdims='x', vdims=['y']).opts(color='red', size=8).opts(frame_width=200)

p1b = hv.Scatter(df, kdims='x', vdims=['y']).opts(color='red', size=8)
df = pd.DataFrame({'x':  [1,2,3], 'y': [3,4,5],})
p2b = hv.Scatter(df, kdims='x', vdims=['y']).opts(color='green', size=8)
pb = hv.NdOverlay({'red':p1b, 'green':p2b}, 'plots').opts(legend_position='right').opts(frame_width=200)

df = pd.DataFrame({'x':  [1,2,3], 'y': [2,3,4],})
p1c = hv.Scatter(df, kdims='x', vdims=['y']).opts(color='red', size=8)
df = pd.DataFrame({'x':  [1,2,3], 'y': [5,6,7],})
p2c = hv.Scatter(df, kdims='x', vdims=['y']).opts(color='green', size=8)
pc = hv.NdOverlay({'red':p1c, 'green':p2c}, 'plots').opts(legend_position='right').opts(frame_width=200)

df = pd.DataFrame({'x':  [1,2,3], 'y': [2,3,4],})
p1d = hv.Scatter(df, kdims='x', vdims=['y']).opts(color='red', size=8)
df = pd.DataFrame({'x':  [1,2,3], 'y': [5,6,7],})
p2d = hv.Scatter(df, kdims='x', vdims=['y']).opts(color='green', size=8)
pd_ = hv.NdOverlay({'red':p1d, 'green':p2d}, 'plots').opts(legend_position='right').opts(frame_width=200)

p = (pa+pb+pc+pd_).cols(2)
p