Deploy app to AWS Elastic Beanstalk

Hi All… has anyone deployed a Panel app to AWS EB. There are examples of deploying to AWS EC2 but EB handles the programs differently.

EB looks for a application.py (which is not a issue) and then a object called application within the program. this should ideally return the bokeh server object i believe. The following code works for Plotly and the “application = app.server” line is what makes it all work on EB

from dash import Dash, dcc, html, Input, Output

app = Dash(name)

app.layout = html.Div([
html.H6(“Change the value in the text box to see callbacks in action!”),
html.Div([
"Input: ",
dcc.Input(id=‘my-input’, value=‘initial value’, type=‘text’)
]),
html.Br(),
html.Div(id=‘my-output’),

])

@app.callback(
Output(component_id=‘my-output’, component_property=‘children’),
Input(component_id=‘my-input’, component_property=‘value’)
)
def update_output_div(input_value):
return f’Output: {input_value}’

application = app.server

if name == ‘main’:
app.run_server(debug=True)

Regards
Chris

1 Like

I have never used aws eb, but based in your comments a similar code in panel is

import panel as pn

if __name__ == "__main__":
    application =  pn.serve(pn.Row('row'))

Thanks… i got it working using the following line, But once i start interacting with the dashboard (selecting different options from one of the dro-downs which filters the data displayed on a chart) it stops updating the dashboard based on selection after a couple of interactions…

The green progress icon (bootstrap) stops working …

Browser inspection revealed the following…

application = pn.serve(
{‘App’: app},
start=True,
port=8100,
websocket_origin=[list of allowed URL/IP and ports])

I think the command has a “allow_” missing

pn.serve(pn.Row('row'), allow_websocket_origin=['*'])

Can you share a MRE with the code? Generally, the CORS error does not allow the application to work neither once.

I was able to recreate the issue… and i’m certain it’s due to the size or number of records of the csv that’s been loaded. You can use the commented-out lines to generate the 3 csv files first and then comment them out

import numpy as np
import pandas as pd
import panel as pn
import hvplot.pandas


measure_selector = pn.widgets.Select(name='station', options=[
    'random_numbers_1', 'random_numbers_2', 'random_numbers_3'], value='random_numbers_1')


# use to generate dummy dataset into file
# data = np.random.randint(5, 3000, size=(100000, 3))
# df = pd.DataFrame(
#     data, columns=['random_numbers_1', 'random_numbers_2', 'random_numbers_3'])
# df.index.name = 'idx'
# df.to_csv(r'random_numbers_1.csv')
# df.to_csv(r'random_numbers_2.csv')
# df.to_csv(r'random_numbers_3.csv')


def create_plot(measure_name):
    print('update plot for', measure_selector.value)

    df = pd.read_csv(measure_name+'.csv')
    return df.hvplot.line(
        x='idx', y=measure_name, label=measure_name,
        width=1500, height=800).opts(tools=['hover'])


layout = pn.Column(pn.Column(measure_selector),
                   create_plot('random_numbers_1'))


def update(event):
    print('field', measure_selector.value)
    layout[1].object = create_plot(measure_selector.value)


measure_selector.param.watch(update, 'value')

app = layout


application = pn.serve(
    {'App': app},
    start=True,
    port=8100,
    websocket_origin=[
        "x.x.x.x:8100"],
    allow_websocket_origin=['*'])

More details from the logs…

The thread seems to be crashing during the backend work of loading data from parquet file

[CRITICAL] WORKER TIMEOUT

I have seen similar errors

but i do not think it is related to the parquet file. You can try it with a smaller csv, you can see the loading data function is loaded. I think it is related to nginx or something like that.

I am following these instructions, but it is not working yet

I deployed the same application on an EC2 (just to take away all the EB-related config…etc) and had the same issue. HTOP shows the CPU going all the way up to 100% and then the thread/session is killed leaving the front-end hanging.

Just for testing purposes, I deployed the same dashboard using Plotly into the same EC2 and it was handling the dashboard perfectly. It also uses 100% of CPU but doesn’t crash like the Bokeh server does.

1 Like

Please be aware that Bokeh/ Panel/ Tornado and Dash/ Flask servers are very different.

Panel runs on the Tornado web server (non-wsgi) and communicates via web sockets.

Dash runs on Flask and communicates via request/ response cycles. It needs a wsgi server like gunicorn to run the application.

The consequence is that deployment of Panel more likely than not will be different than Dash.

I continue checking this. Due to the difference that marc points out, the only way this can work is with docker.

This repo has some instructions, but i could not make it work yet.

Hi @chrisj

I finally could make it work in AWS ELB with Docker. I needed 3 files: application.py, Dockerfile, and requirements.txt. As previously said, the bokeh server is not WSGI, so it can not be deployed as a single py file like the dash example. The docker container is needed for the websocket used by bokeh can work.

application.py

import numpy as np
import pandas as pd
import panel as pn
import hvplot.pandas

measure_selector = pn.widgets.Select(name='station', options=[
    'random_numbers_1', 'random_numbers_2', 'random_numbers_3'], value='random_numbers_1')

# use to generate dummy dataset into file
data = np.random.randint(5, 3000, size=(100000, 3))
df = pd.DataFrame(
    data, columns=['random_numbers_1', 'random_numbers_2', 'random_numbers_3'])
df.index.name = 'idx'
df.to_csv(r'random_numbers_1.csv')
df.to_csv(r'random_numbers_2.csv')
df.to_csv(r'random_numbers_3.csv')

def create_plot(measure_name):
    print('update plot for', measure_selector.value)

    df = pd.read_csv(measure_name+'.csv')
    return df.hvplot.line(
        x='idx', y=measure_name, label=measure_name,
        width=1500, height=800).opts(tools=['hover'])

layout = pn.Column(pn.Column(measure_selector),
                   create_plot('random_numbers_1'))

def update(event):
    print('field', measure_selector.value)
    layout[1].object = create_plot(measure_selector.value)

measure_selector.param.watch(update, 'value')
layout.servable()

Dockerfile

FROM continuumio/miniconda3

EXPOSE 5006
EXPOSE 80

COPY requirements.txt .
RUN pip install -r requirements.txt

COPY application.py .
CMD panel serve --show \
    --allow-websocket-origin="*" \
    application.py

requirements.txt

numpy
panel
pandas
hvplot

The steps I followed were:

  1. Install the aws eb CLI (Install the EB CLI - AWS Elastic Beanstalk)

  2. Execute eb init and apply default values.

  3. Execute eb create and apply default values.

  4. Execute git add .

  5. Execute git commit -m "commit files"

  6. Execute eb deploy

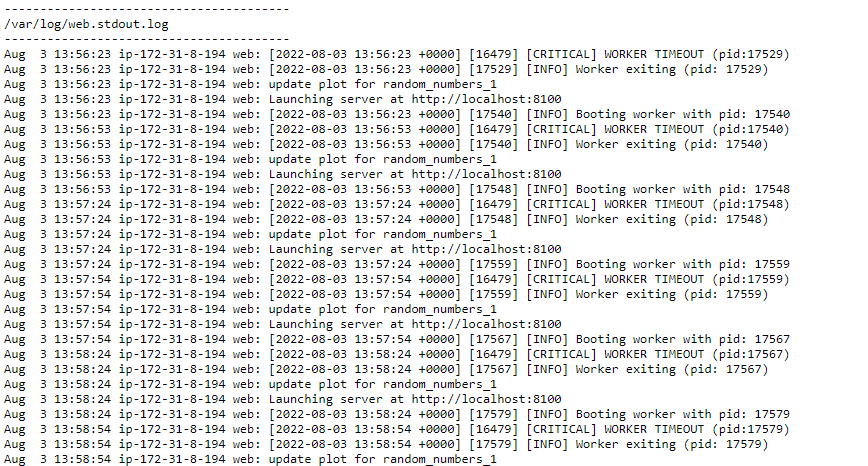
I read in several places that in and out rules need to be defined in port 80 and 5006 and tried them (Configure security groups for your Classic Load Balancer - Elastic Load Balancing), but I think they were finally not used.

aws

Additional info: As you can see in the video, the app is something slow. It would be worthwhile to check the ```pn.state.cache`` option to load the data faster (Panel Performance larger Files). Another thing that can improve the time response is to try Datashader (https://datashader.org/), due bokeh can not handle big data optimally. Other options would be sub-sampling the data or using Plotly with a novel package called plotly-resampler (GitHub - predict-idlab/plotly-resampler: Visualize large time series data with plotly.py). It is not clear which solution is better, so you need to give them a try to see which adapts better to your requirements.

2 Likes

Excellent…thanks for the effort… i will look into this and get back to you.

1 Like

Can you share the config.yml file for AWS EB that was generated when the eb init was executed?

branch-defaults:
  main:
    environment: panel-env
    group_suffix: null
  master:
    environment: null
    group_suffix: null
global:
  application_name: panelApp
  branch: null
  default_ec2_keyname: aws-eb
  default_platform: Docker running on 64bit Amazon Linux 2
  default_region: us-west-2
  include_git_submodules: true
  instance_profile: null
  platform_name: null
  platform_version: null
  profile: eb-cli
  repository: null
  sc: git
  workspace_type: Application

Thanks for the code… I got it working and implemented the cache as well. But the strangest thing is while i was testing from 2 devices for concurrent performance… (laptop and mobile both on different networks) i noticed that the dashboard on all devices are in sync…

eg:- If on the mobile i select option #2 from the drop-down, the dashboard on the laptop also changes to the same selection automatically

You need to wrap all the logic into a function and do something like this:

import numpy as np
import pandas as pd
import panel as pn
import hvplot.pandas


def dashboard():
    measure_selector = pn.widgets.Select(name='station', options=[
        'random_numbers_1', 'random_numbers_2', 'random_numbers_3'], value='random_numbers_1')

    # use to generate dummy dataset into file
    data = np.random.randint(5, 3000, size=(100000, 3))
    df = pd.DataFrame(
        data, columns=['random_numbers_1', 'random_numbers_2', 'random_numbers_3'])
    df.index.name = 'idx'
    df.to_csv(r'random_numbers_1.csv')
    df.to_csv(r'random_numbers_2.csv')
    df.to_csv(r'random_numbers_3.csv')

    def create_plot(measure_name):
        print('update plot for', measure_selector.value)

        df = pd.read_csv(measure_name+'.csv')
        return df.hvplot.line(
            x='idx', y=measure_name, label=measure_name,
            width=1500, height=800).opts(tools=['hover'])

    layout = pn.Column(pn.Column(measure_selector),
                    create_plot('random_numbers_1'))

    def update(event):
        print('field', measure_selector.value)
        layout[1].object = create_plot(measure_selector.value)

    measure_selector.param.watch(update, 'value')

    return layout

pn.panel(dashboard).servable()
1 Like

In the example the layout object is global. You need to encapsulate it in a function. Then, each time a user request a new session, a different object is served.

1 Like

The ability of a global function is quite powerful. You can use it to broadcast shared messages or to have a remoting testing session where people at both ends can explore the exact same app instance.

2 Likes

Thanks… Silly me.

1 Like