When trying to plot multiple dataframe columns with hvplot and the plotly backend enabled, an error occurs about the ‘muted_alpha’ option not being available for the plotly backend.
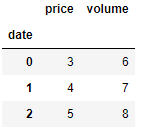
Data:
Code:
import holoviews as hv
import numpy as np
import pandas as pd
import panel as pn
import hvplot.pandas
hv.extension('plotly')
pn.extension('plotly')
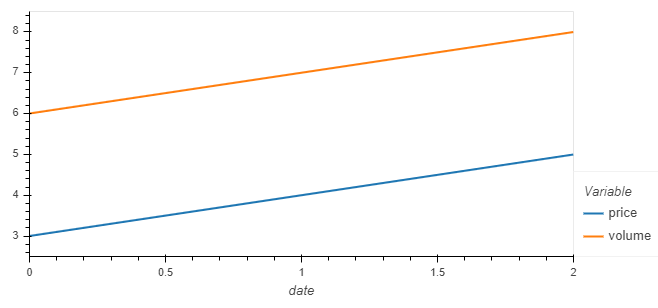
df = pd.DataFrame({"date":[0,1,2],"price":[3,4,5],"volume":[6,7,8]}).set_index("date")
df.hvplot()
Error:
ValueError: Unexpected option ‘muted_alpha’ for Curve type when using the ‘plotly’ extension. No similar options founds.
Bokeh backend: