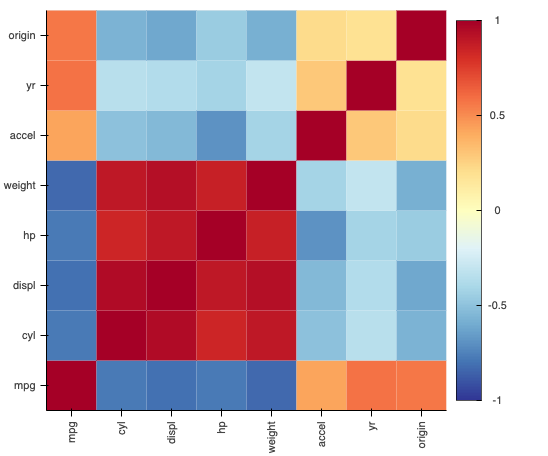
Is it possible to make an heatmap with correlation values of the data, like this one in the picture below?
The easiest way to generate a correlation matrix is to use pandas to compute it and then construct it like this:
import pandas as pd
from bokeh.sampledata.autompg import autompg
corr = autompg.corr()
hv.HeatMap((corr.index, corr.columns, corr.values))