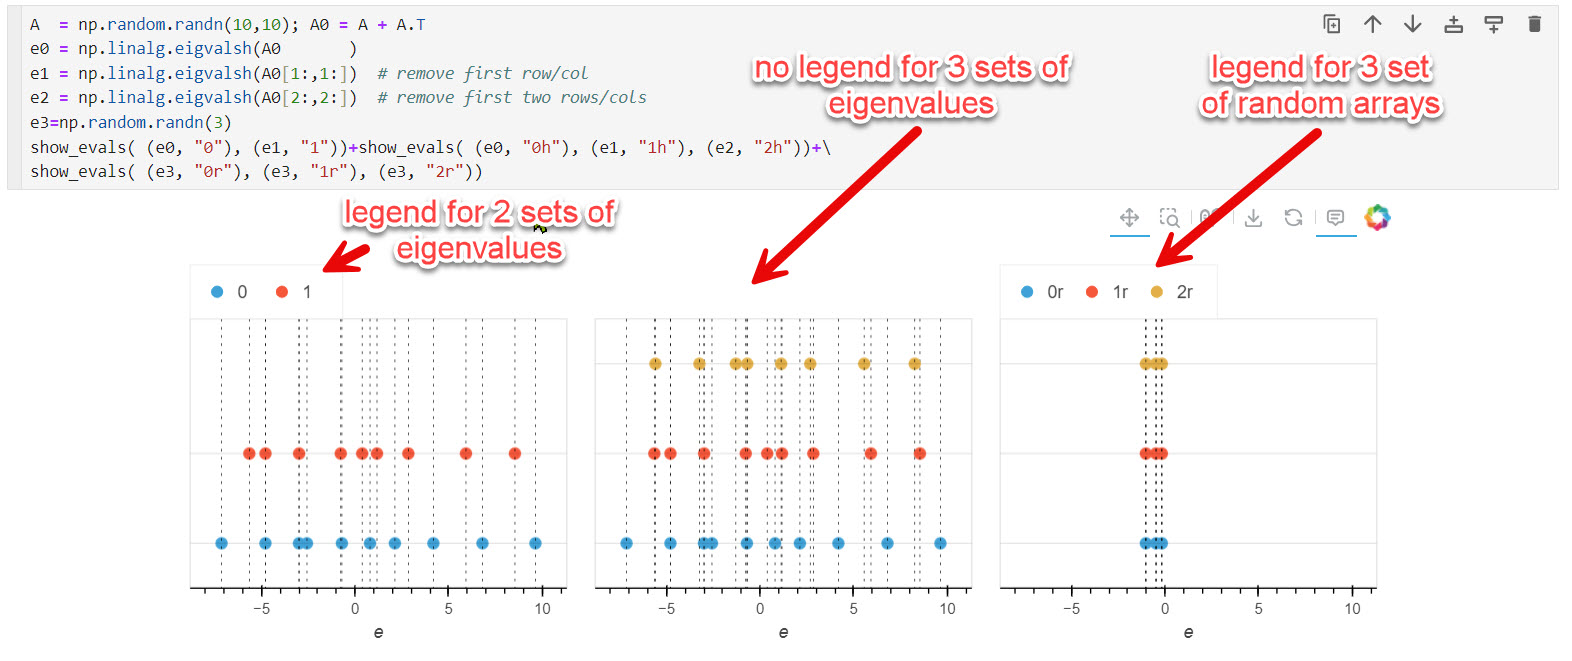
legends disappear when there are more than two np.linalg.eigvals() vectors.
The legends do appear if the vectors are simply defined with np.random.randn()
import numpy as np
import holoviews as hv; hv.extension('bokeh')
def show_evals( *evals ):
"""evals are tuples of (eigenvalues, label)"""
top = len(evals)
components = []
for (i,(eigs,l)) in enumerate(evals):
components.append( hv.Points( (eigs, np.repeat(i,len(eigs))), ["e"," "], label=l ))
components.extend( [hv.VLine( e ) for e in eigs] )
components.append( hv.HLine(i, label=l) )
o = [hv.opts.Points(size=8, muted_alpha=0),
hv.opts.VLine(color='k', line_width=0.5, muted_alpha=0, line_dash="dotted"),
hv.opts.HLine(color='k', line_width=0.1, muted_alpha=0),
hv.opts.Overlay( ylim=(-0.5,top-0.5), legend_position='top', yaxis=None)
]
return hv.Overlay( components ).opts(o)
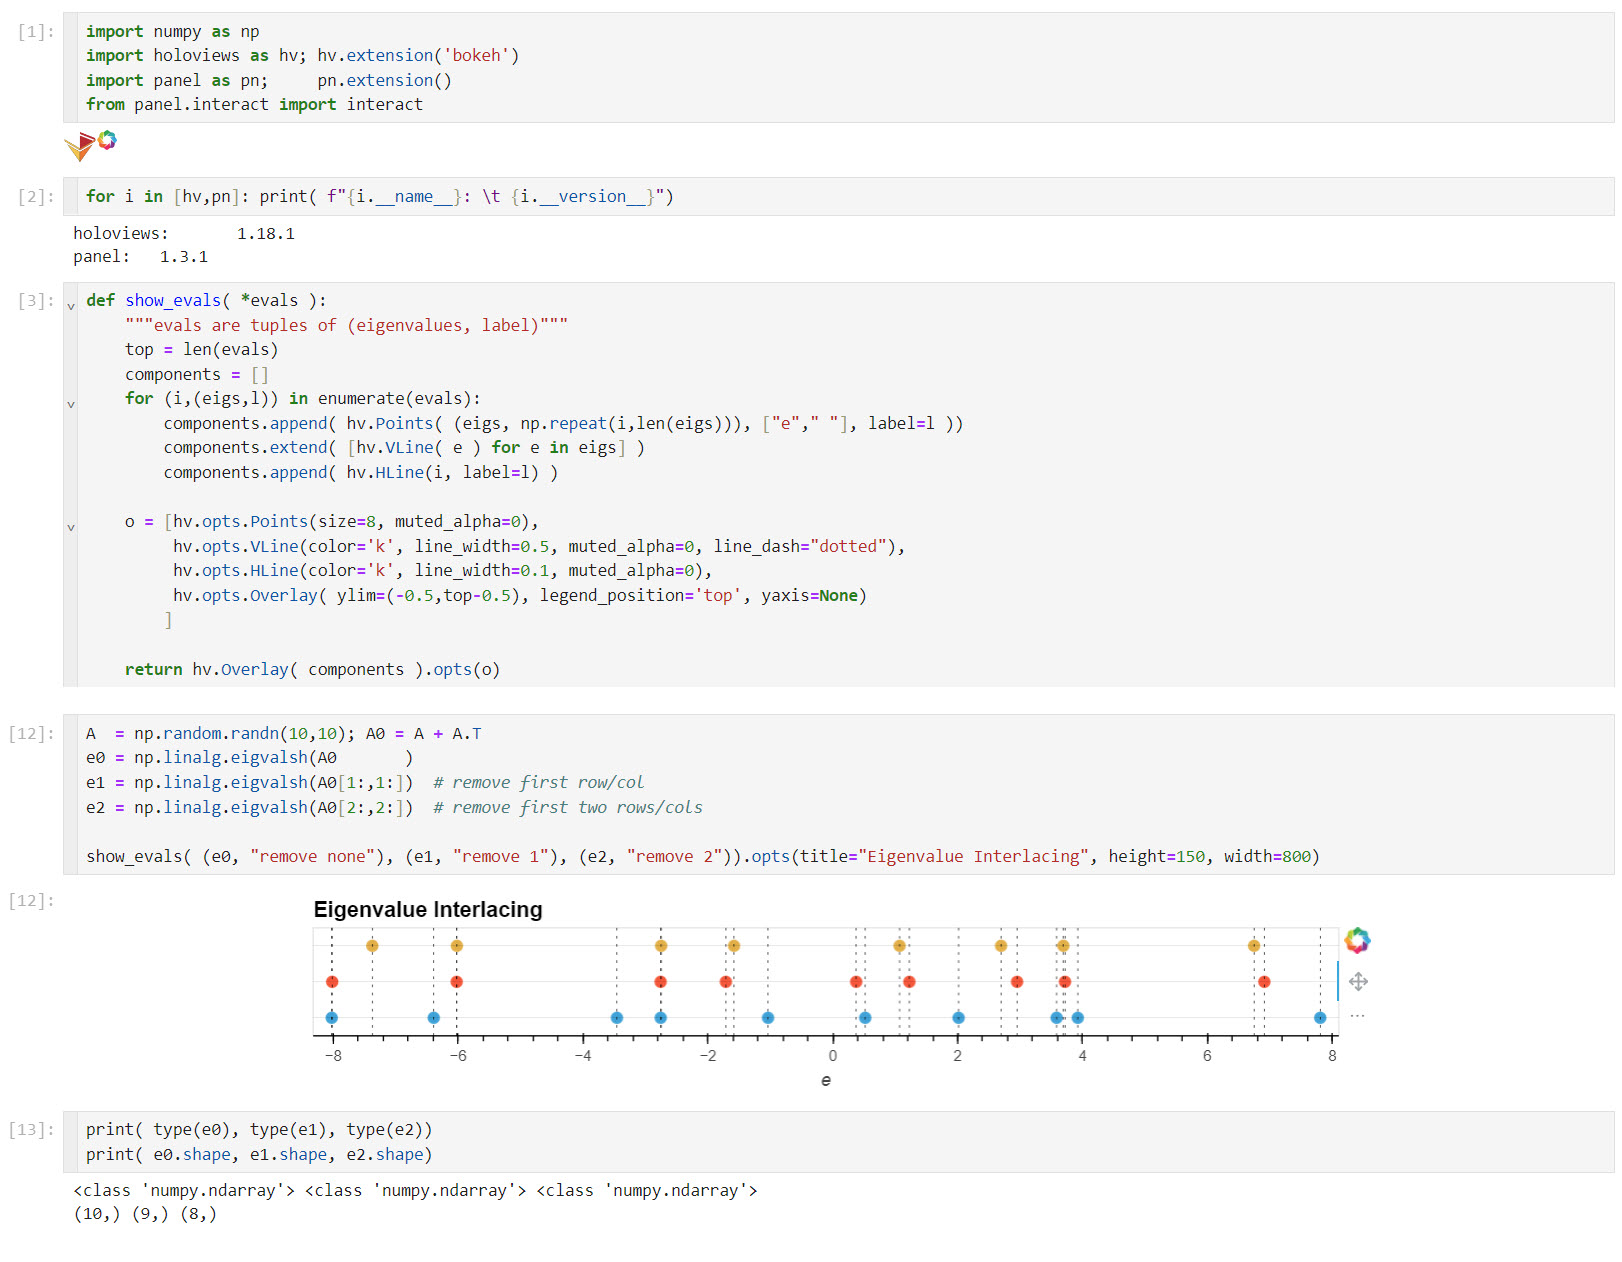
A = np.random.randn(10,10); A0 = A + A.T
e0 = np.linalg.eigvalsh(A0 )
e1 = np.linalg.eigvalsh(A0[1:,1:]) # remove first row/col
e2 = np.linalg.eigvalsh(A0[2:,2:]) # remove first two rows/cols
show_evals( (e0, "remove none"), (e1, "remove 1"), (e2, "remove 2")).opts(title="Eigenvalue Interlacing", height=150, width=800)
the plot with two sets of eigenvalues displays the legends,
the plot with 3 sets does not.