I’m getting started with HoloViews and I’m still trying to wrap my head around the declarative approach, so please bear with me if these are dumb questions.
I’m having trouble with customizing a bar plot I’m making. In short, the bars are overlapping where I would like them to be shown side by side.
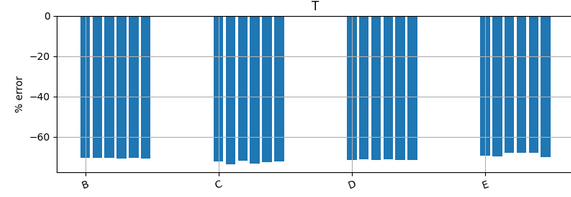
This is what I would like it to look like:
(see the comment as I can only embed 1 media item)
But right now it’s looking like this
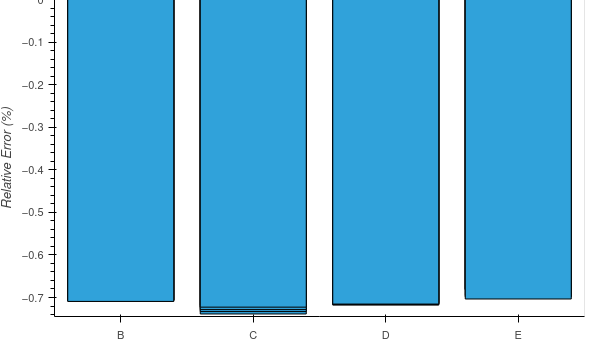
I understand that this is happening because the key dimension I set is the same for all of the bars that get overlapped. This is normal, since the individual bars are just anonymous but distinct measures of the same thing.
Does anyone know how I can get HoloViews to display it this way?