Dear all,
Has anyone already faced a problem of two holoviews plots unwillingly sharing the same data ranges? I have a panel dashboard that calls two distinct plots and present them side by side and each one of them inside a WidgetBox. Each plot is generated as in the script below and apparently have nothing in common (the plot_opts are local variables!). Even though, in the final result they share the data range (the one in the right takes the data range of the one in the left).
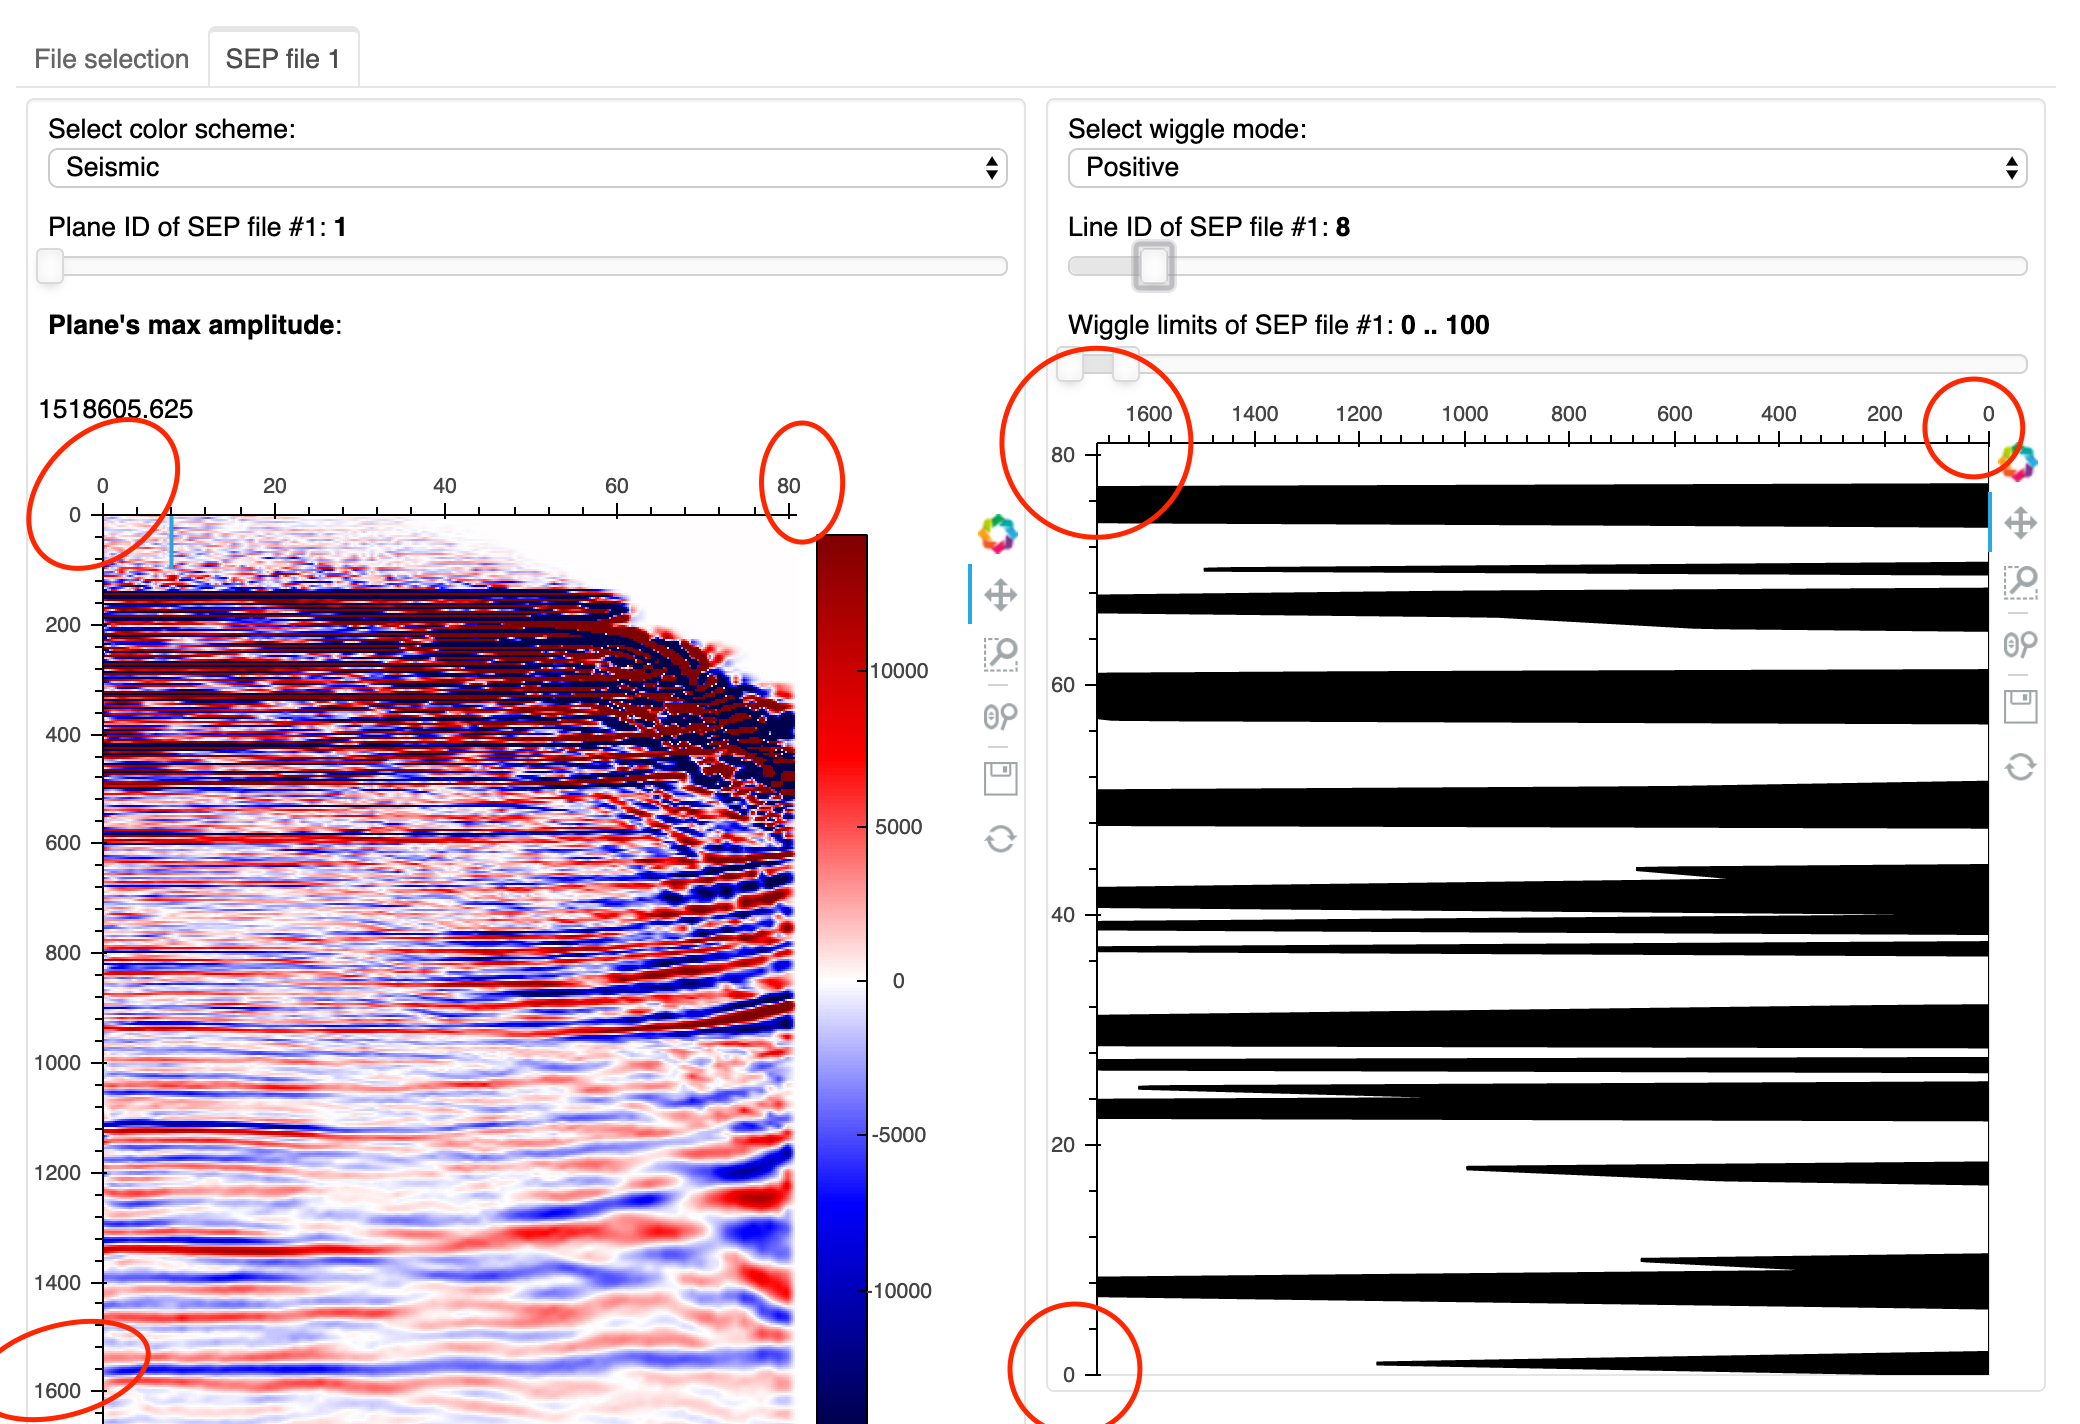
Is this an issue or just me screwing things up?
import numpy as np
import holoviews as hv
from holoviews import opts
from holoviews import streams
from holoviews.operation.datashader import regrid
hv.extension('bokeh')

def getPlanePlot(plane, cmap, origin_file_type):

    if origin_file_type == 'sep_gathers' or origin_file_type == 'segy_gathers':
        clip = 99
        half_range = (plane.max() - plane.min())/2
        m_clip = (half_range / 100.) * clip
        vmin = -half_range + m_clip
        vmax = -vmin
        height=500
        width=500

    elif origin_file_type == 'velocity_model':
        clip=np.percentile(plane, 99.9)
        vmin = clip
        vmax = -vmin
        height=500
        width=750

    plane = plane[::-1,:]
    bounds=(0, 0, plane.shape[1], plane.shape[0])
    plot_opts = {
                'height': height,
                'width': width,
                'colorbar': True,
                'clim':(vmin, vmax),
                'xlabel': '',
                'ylabel': '',
                'xlim': (0, plane.shape[1]),
                'ylim': (0, plane.shape[0]),
                'xaxis': 'top',
                'invert_yaxis': True,
                }
    style_opts = {'cmap': cmap}
    img = hv.Image(plane, bounds=bounds).opts(plot=plot_opts, style=style_opts)
    return regrid(img, upsample=True, interpolation='bilinear', precompute=True)

def PlotTrace(plane, line_id, wiggle, wiggle_limits):

    aspect=500

    vmin = round(wiggle_limits[0])
    vmax = round(wiggle_limits[1])
    trace = np.round(plane[line_id-1][vmin:vmax], 5)
    x = np.arange(vmin, vmax)
    x_interp = np.linspace(vmin, vmax, 20*len(x))
    trace_interp = np.interp(x_interp, x, trace)
    lim = 1.05*max((abs(trace.min()), trace.max()))

    if wiggle == 'Positive':
        w = np.array([i if i > 0 else 0 for i in trace_interp])
    elif wiggle == 'Negative':
        w = np.array([i if i < 0 else 0 for i in trace_interp])
    else:
        w = np.zeros(len(trace_interp))

    plot_opts_trace = {'height': aspect,
                       'width': aspect,
                       'xlabel': '',
                       'ylabel': '',
                       'xlim': (vmin, vmax),
                       'ylim': (-lim, lim),
                       'xaxis': 'top',
                       'invert_yaxis': True,
                       'invert_axes': True,
                     }

    style_opts_curve = {'color': 'k'}
    style_opts_area = {'fill_color': 'k'}

    return hv.Area((x_interp, w)).opts(plot=plot_opts_trace, style=style_opts_area) * hv.Curve((x_interp, trace_interp)).opts(plot=plot_opts_trace, style=style_opts_curve)