pgierz
February 3, 2022, 3:13pm
1
Hello,
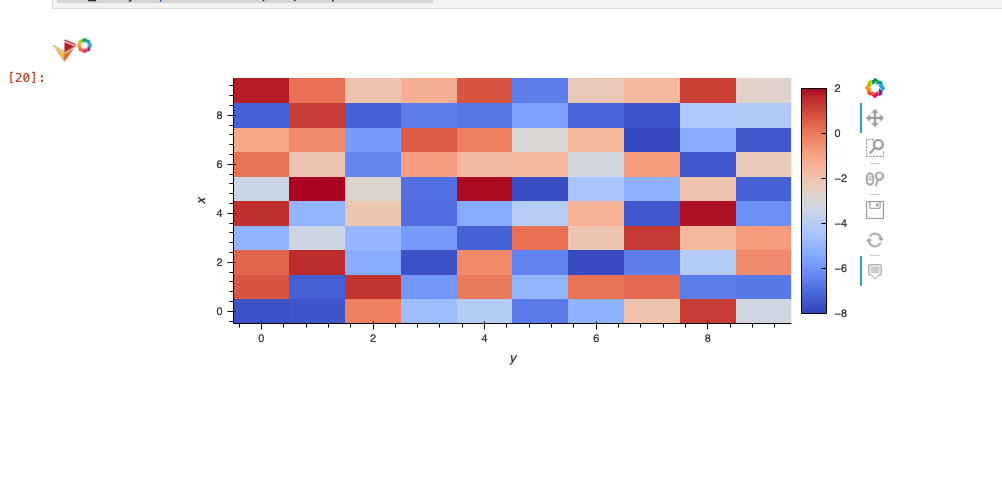
is it possible to shift the “zero” point of a colorbar somehow? Say I have data from -8 to +2, and want the white to still be at 0:
import holoviews as hv
import numpy as np
import xarray as xr
import hvplot.xarray

hv.extension('bokeh')
data = np.random.random((10,10))
data = 10 * (data - 0.8)
test_array = xr.DataArray(
    data,
    coords=[np.arange(10), np.arange(10)],
    dims=['x','y'], name='z')
test_array.hvplot(clim=(-8, 2), cmap="coolwarm")
This results in a figure, but obviously many of the negative values will still be red!
I found this, but cannot figure out how to use it:
I figured out how create a diverging asymmetric colorbar in bokeh and use it in a bokeh chart. Was so happy about that I wrote a blog post about it! https://www.rbtechblog.com/blog/stocks2018#colorbar And @anon10586594 has tweeted about it! I am...
Reading time: 1 mins 🕑
Likes: 2 ❤
There is:
bokeh.palettes.diverging_palette?
But this takes two colorbars, instead of 1.
pgierz
February 3, 2022, 3:32pm
2
Here is one way to do it, but I don’t like it terribly. I am not sure if a) it covers all the colorbars available in holoviews (matplotlib, bokeh, colorcet, cmocean) and b) it would be nice to have an option to set in the hvplot or holoviews opts command
from matplotlib import colors
import numpy as np
divnorm = colors.TwoSlopeNorm(vmin=-8., vcenter=0., vmax=2)
levels = np.arange(-8, 2.5, 0.5)
colors = [colors.to_hex(c, keep_alpha=True) for c in plt.cm.coolwarm(divnorm(levels))]
test_array.hvplot(clim=(-8, 2), cmap=colors)
1 Like
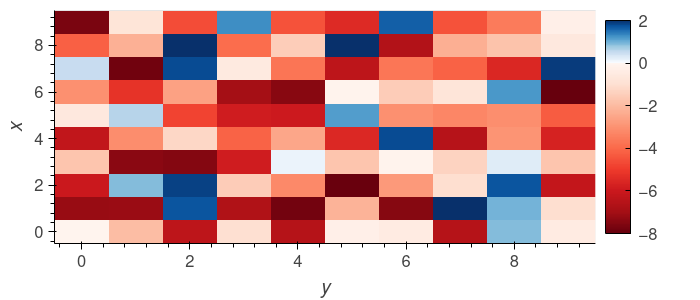
Found this post while contemplating the same problem. Something like this will do it using bokeh.palettes.diverging_palette
import holoviews as hv
import numpy as np
import xarray as xr
import hvplot.xarray
import bokeh.palettes

hv.extension("bokeh")

ncolors = 256
cmin = -8.0
cmax = 2.0
cmid = 0.0
c_diverge_point_normalized = (cmid - cmin) / (cmax - cmin)
colors = bokeh.palettes.diverging_palette(
    bokeh.palettes.Reds[ncolors],
    bokeh.palettes.Blues[ncolors],
    n=ncolors,
    midpoint=c_diverge_point_normalized,
)

# plotting code below same as OP except cmap argument to hvplot() changed "coolwarm" to colors
data = np.random.random((10, 10))
data = 10 * (data - 0.8)
test_array = xr.DataArray(data, coords=[np.arange(10), np.arange(10)], dims=["x", "y"], name="z")
p = test_array.hvplot(clim=(-8, 2), cmap=colors)
hvplot.show(p)
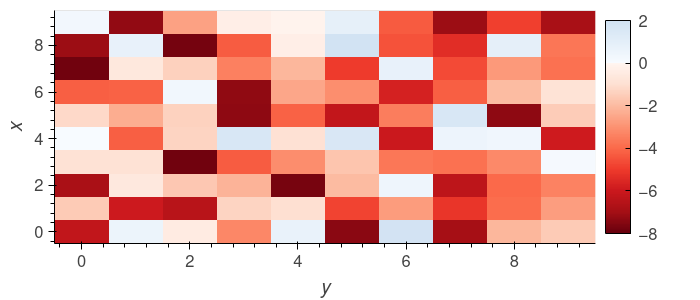
This tweak changes the above to use only the lighter portion of the blue colormap, so that -2 and 2 have roughly the same lightness/darkness.
import holoviews as hv
import numpy as np
import xarray as xr
import hvplot.xarray
import bokeh.palettes

hv.extension("bokeh")

ncolors = 256
cmin = -8.0
cmax = 2.0
cmid = 0.0
c_diverge_point_normalized = (cmid - cmin) / (cmax - cmin)
palette_cutoff = round(c_diverge_point_normalized * ncolors)
colors = bokeh.palettes.diverging_palette(
    bokeh.palettes.Reds[ncolors],
    bokeh.palettes.Blues[ncolors][palette_cutoff:],
    n=ncolors,
    midpoint=c_diverge_point_normalized,
)

# plotting code below same as OP except cmap argument to hvplot() changed "coolwarm" to colors
data = np.random.random((10, 10))
data = 10 * (data - 0.8)
test_array = xr.DataArray(data, coords=[np.arange(10), np.arange(10)], dims=["x", "y"], name="z")
p = test_array.hvplot(clim=(-8, 2), cmap=colors)
hvplot.show(p)
1 Like